Your portfolio, on your own machine.
Bullhorn is a local-first investor OS — a dashboard, signal engine, news desk, and tax ledger for your whole book. It runs in your browser and keeps your holdings on your device, not on someone else's server.
This guide walks through every screen, in order. Five minutes end-to-end; jump to any module from the left.
Brokerage, registered, crypto, cash — aggregated into a single net-worth view.
10+ technical indicators converge into one verdict per ticker.
No login, no upload. Your positions live in your browser's storage.
Seven interface skins, a dense mode, and a paper-trading sandbox.
Getting started
There's no sign-up. Open Bullhorn and you're in. Here's the shortest path from empty to a working book.
1 · Add your first holding
From Portfolio, use the ticker search to find a symbol, then enter what you actually paid: average cost and quantity. Bullhorn pulls the live price and computes market value, unrealized P&L, and a technical signal for you.
Each position has a free-text thesis field — "Why did you buy this? What's your target?" Fill it in. Future-you will want to know what past-you was thinking.
2 · Record cash & liabilities
In Settings you can add cash balances and liabilities — a mortgage, a credit-card balance, anything — so your net worth reflects the whole picture, not just equities.
3 · Watch what you don't own yet
Drop prospects onto the Watchlist and group them. Set price alerts so Bullhorn nudges you when a level hits.
4 · Read the signals
Once you hold a few names, Convergence and Signals light up with per-ticker conviction scores, and the Dashboard summarizes the whole book at a glance.
Accounts & net worth
Run as many accounts as you actually have — and see them together or one at a time.
- Multiple accounts. Create accounts for each broker, registered plan, or wallet. Name and select them from the account pill in the top-right.
- "All accounts" aggregate. Pick All accounts to roll every position into one combined view — the default for the Dashboard.
- Net worth = holdings + cash − liabilities. Bullhorn nets your market value against the liabilities you record in Settings, so the headline number is your real number.
Live vs Paper
The LIVE / PAPER pill in the navbar switches between your real book and a sandbox.
- Live is your actual portfolio — the positions, cash, and accounts you've entered.
- Paper is a fully separate sandbox. It's stored under its own namespace, so anything you do there — test trades, what-ifs, a throwaway model book — never touches your live data.
Switching modes swaps the entire dataset behind the app. Your live book is exactly where you left it when you flip back.
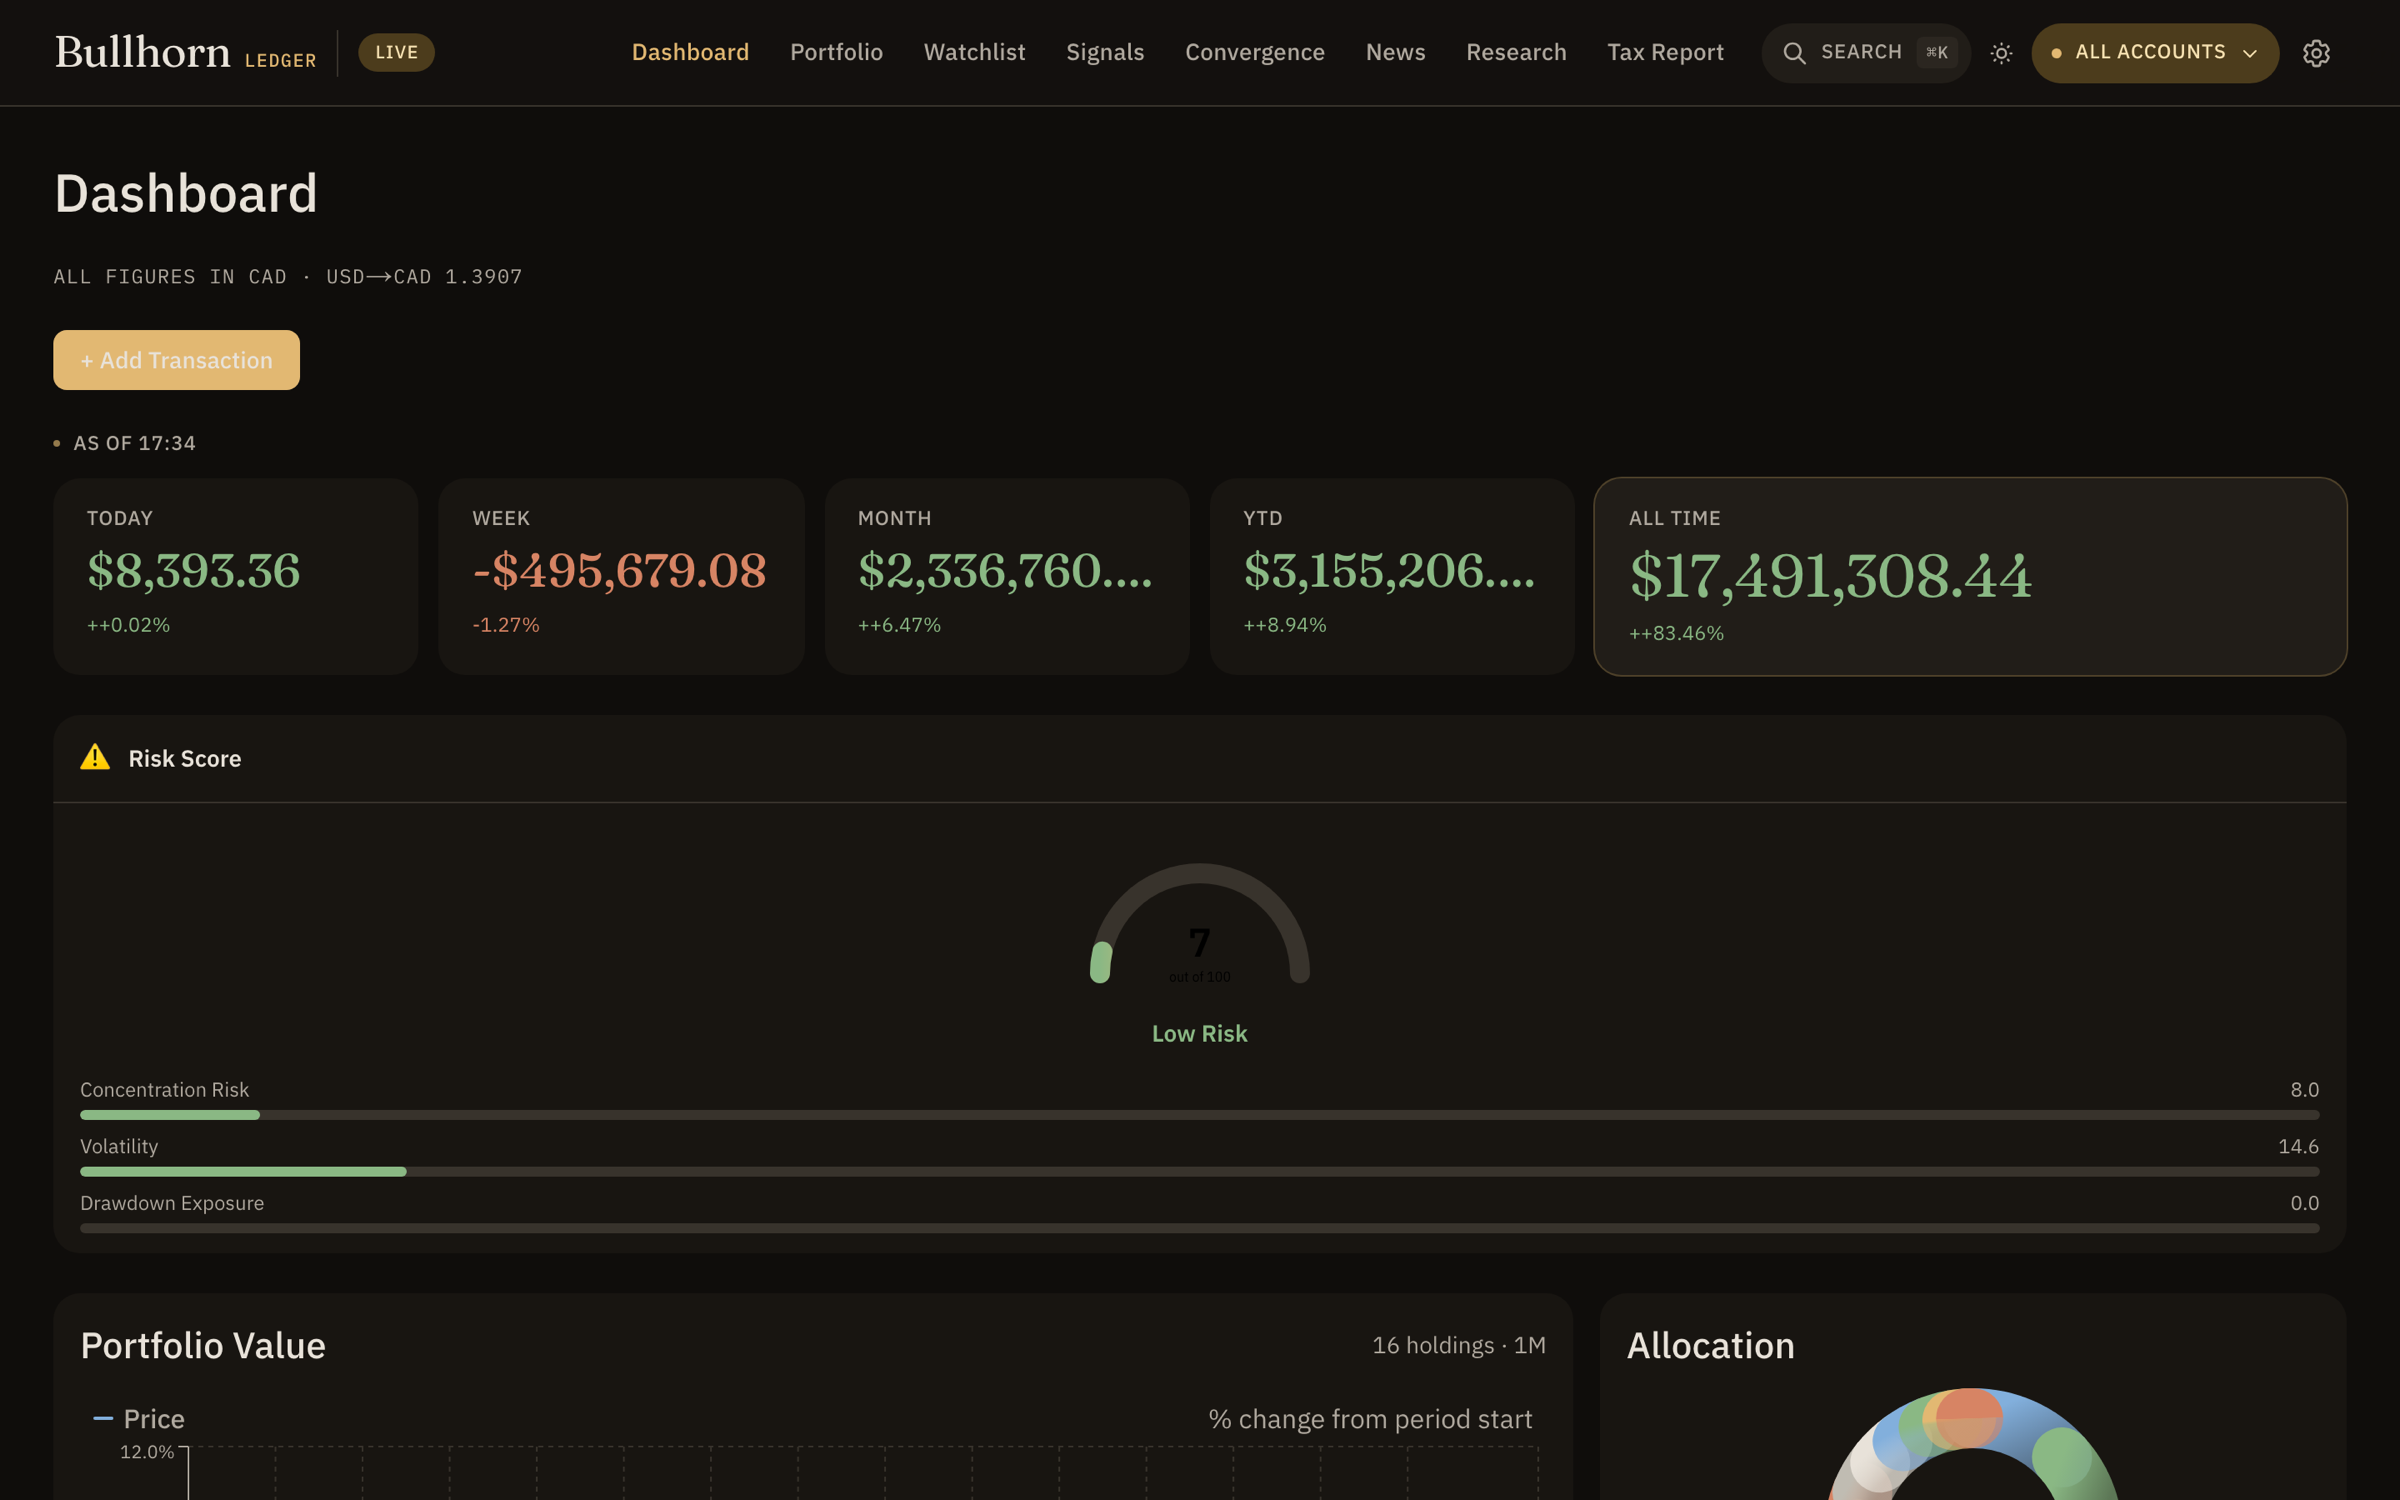
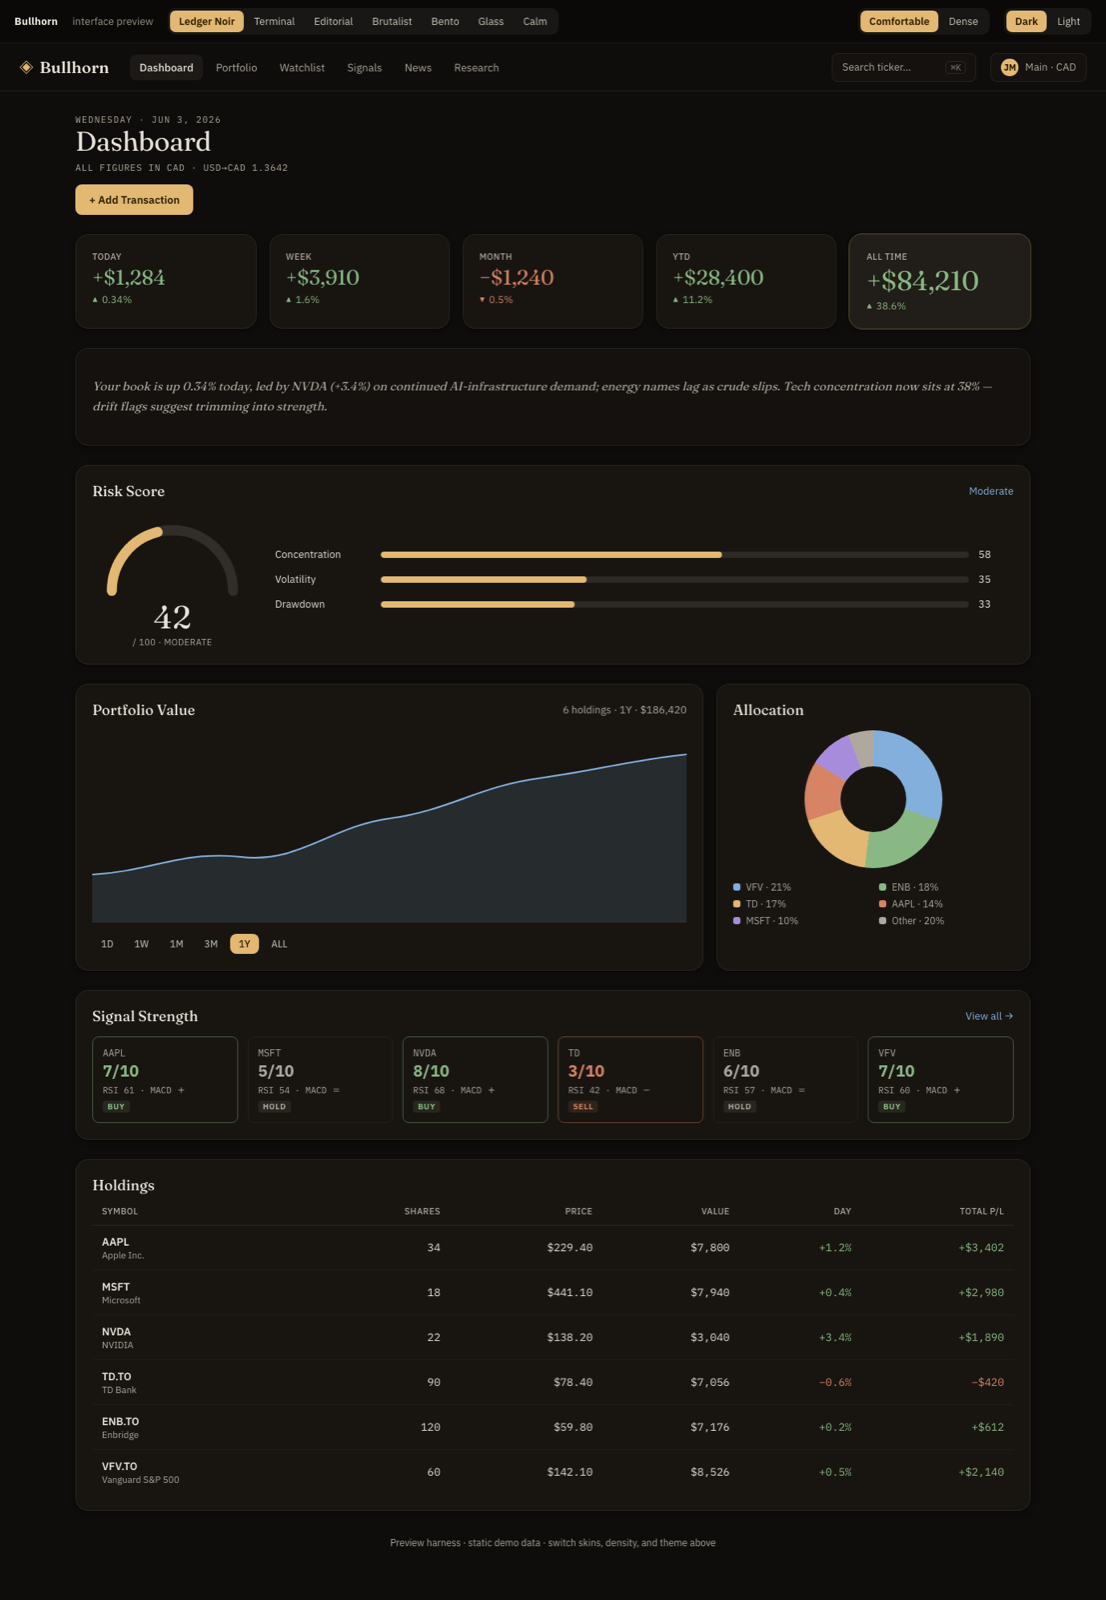
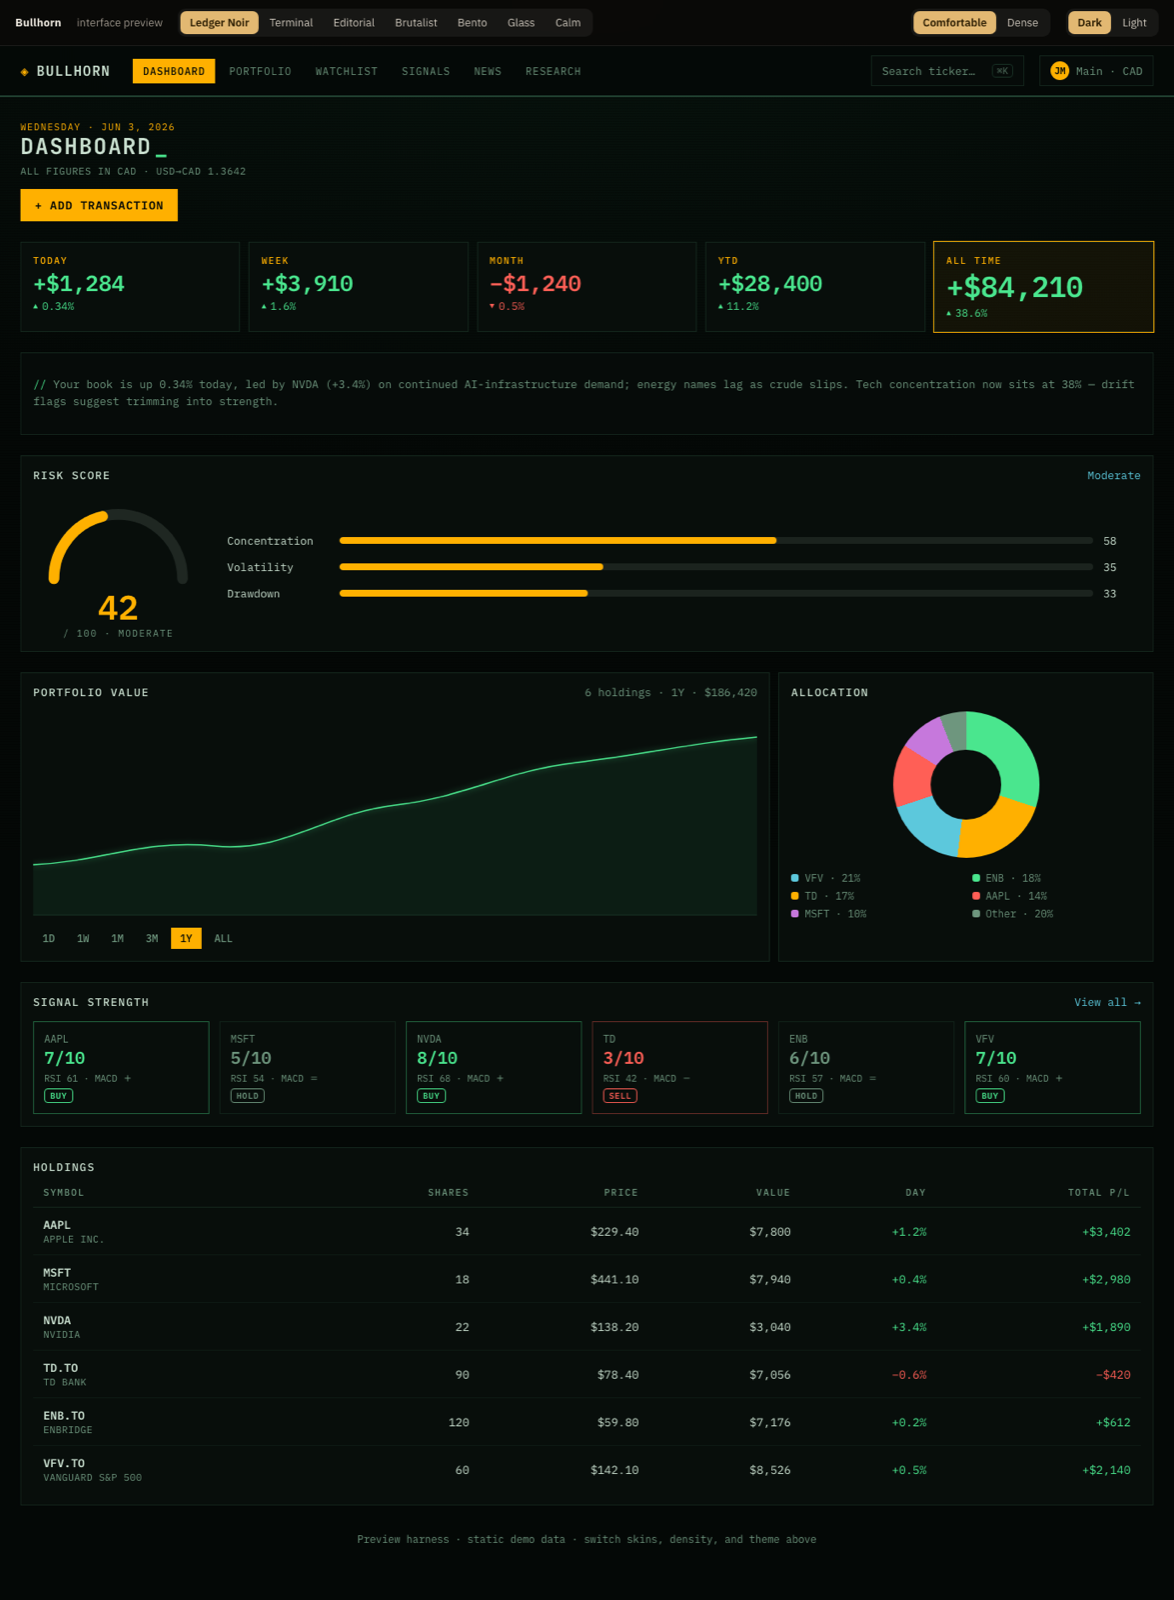
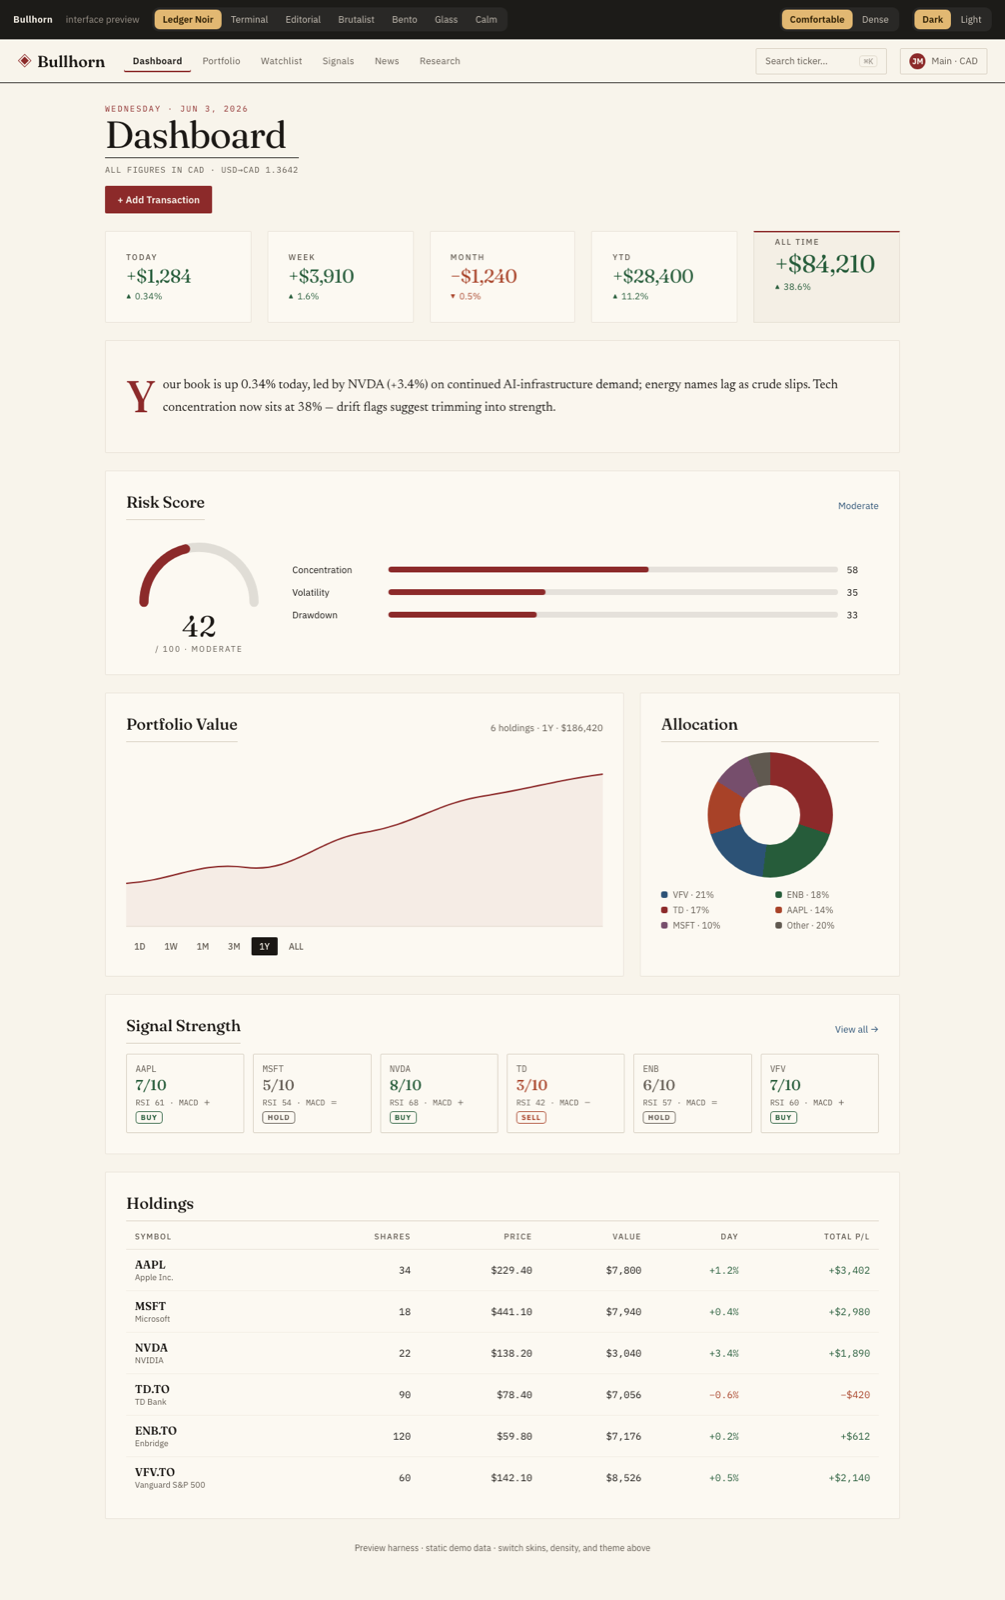
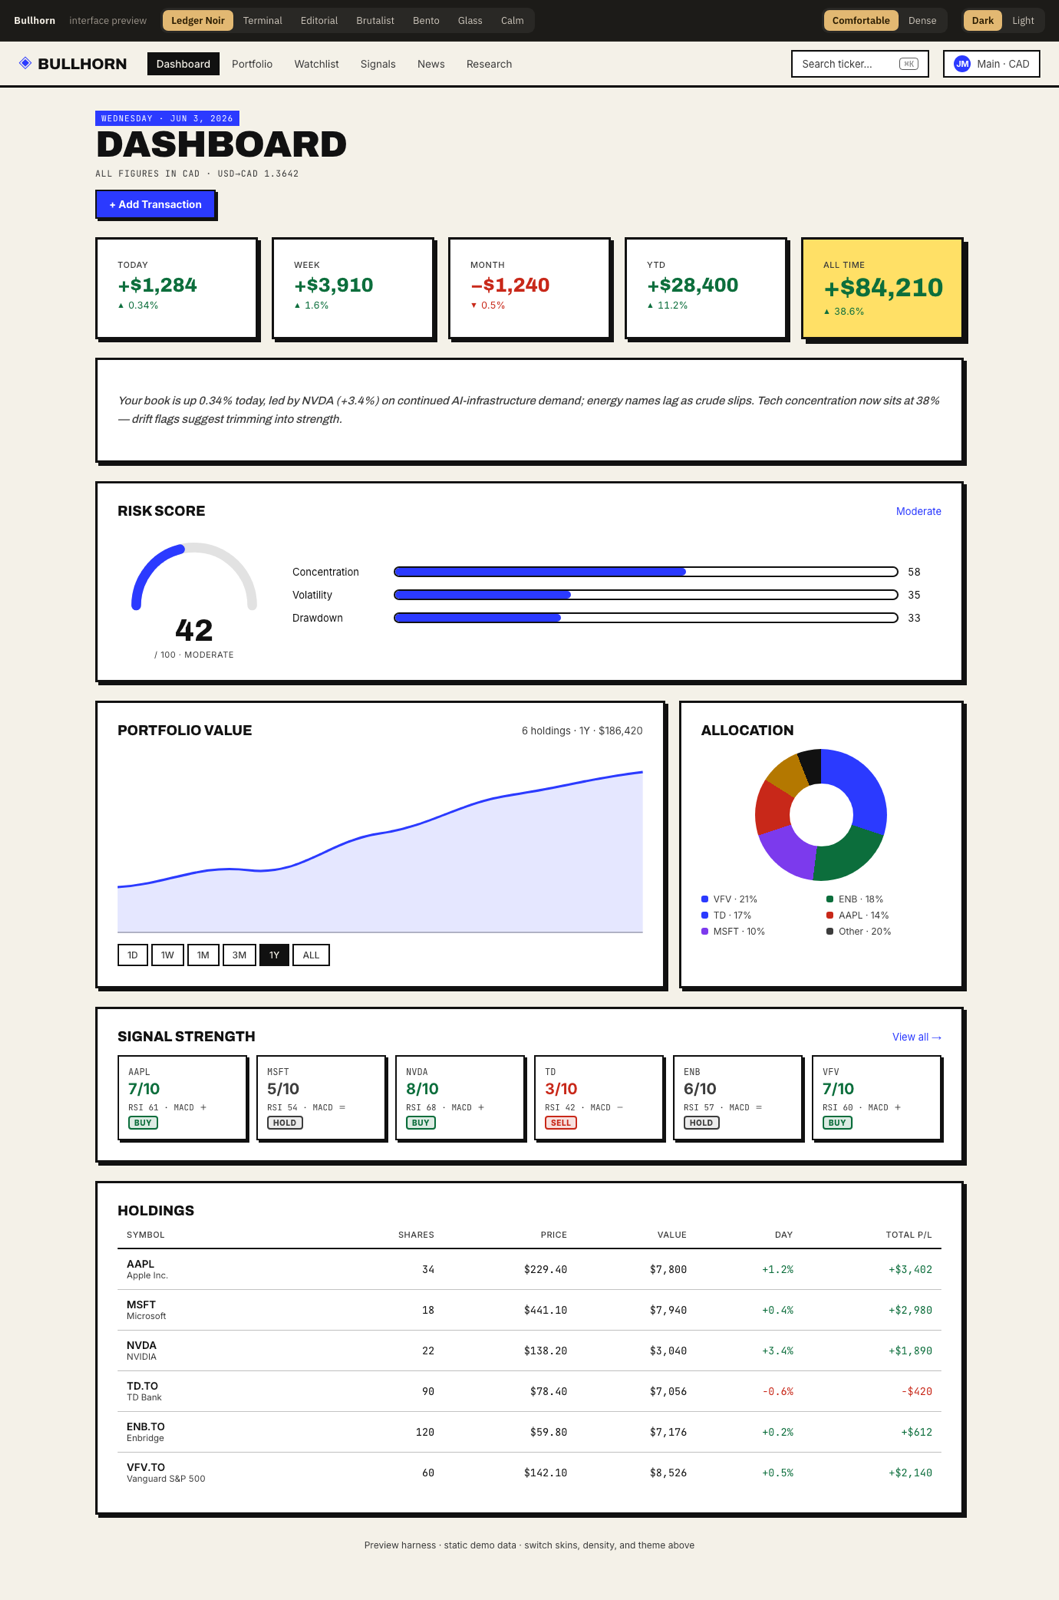
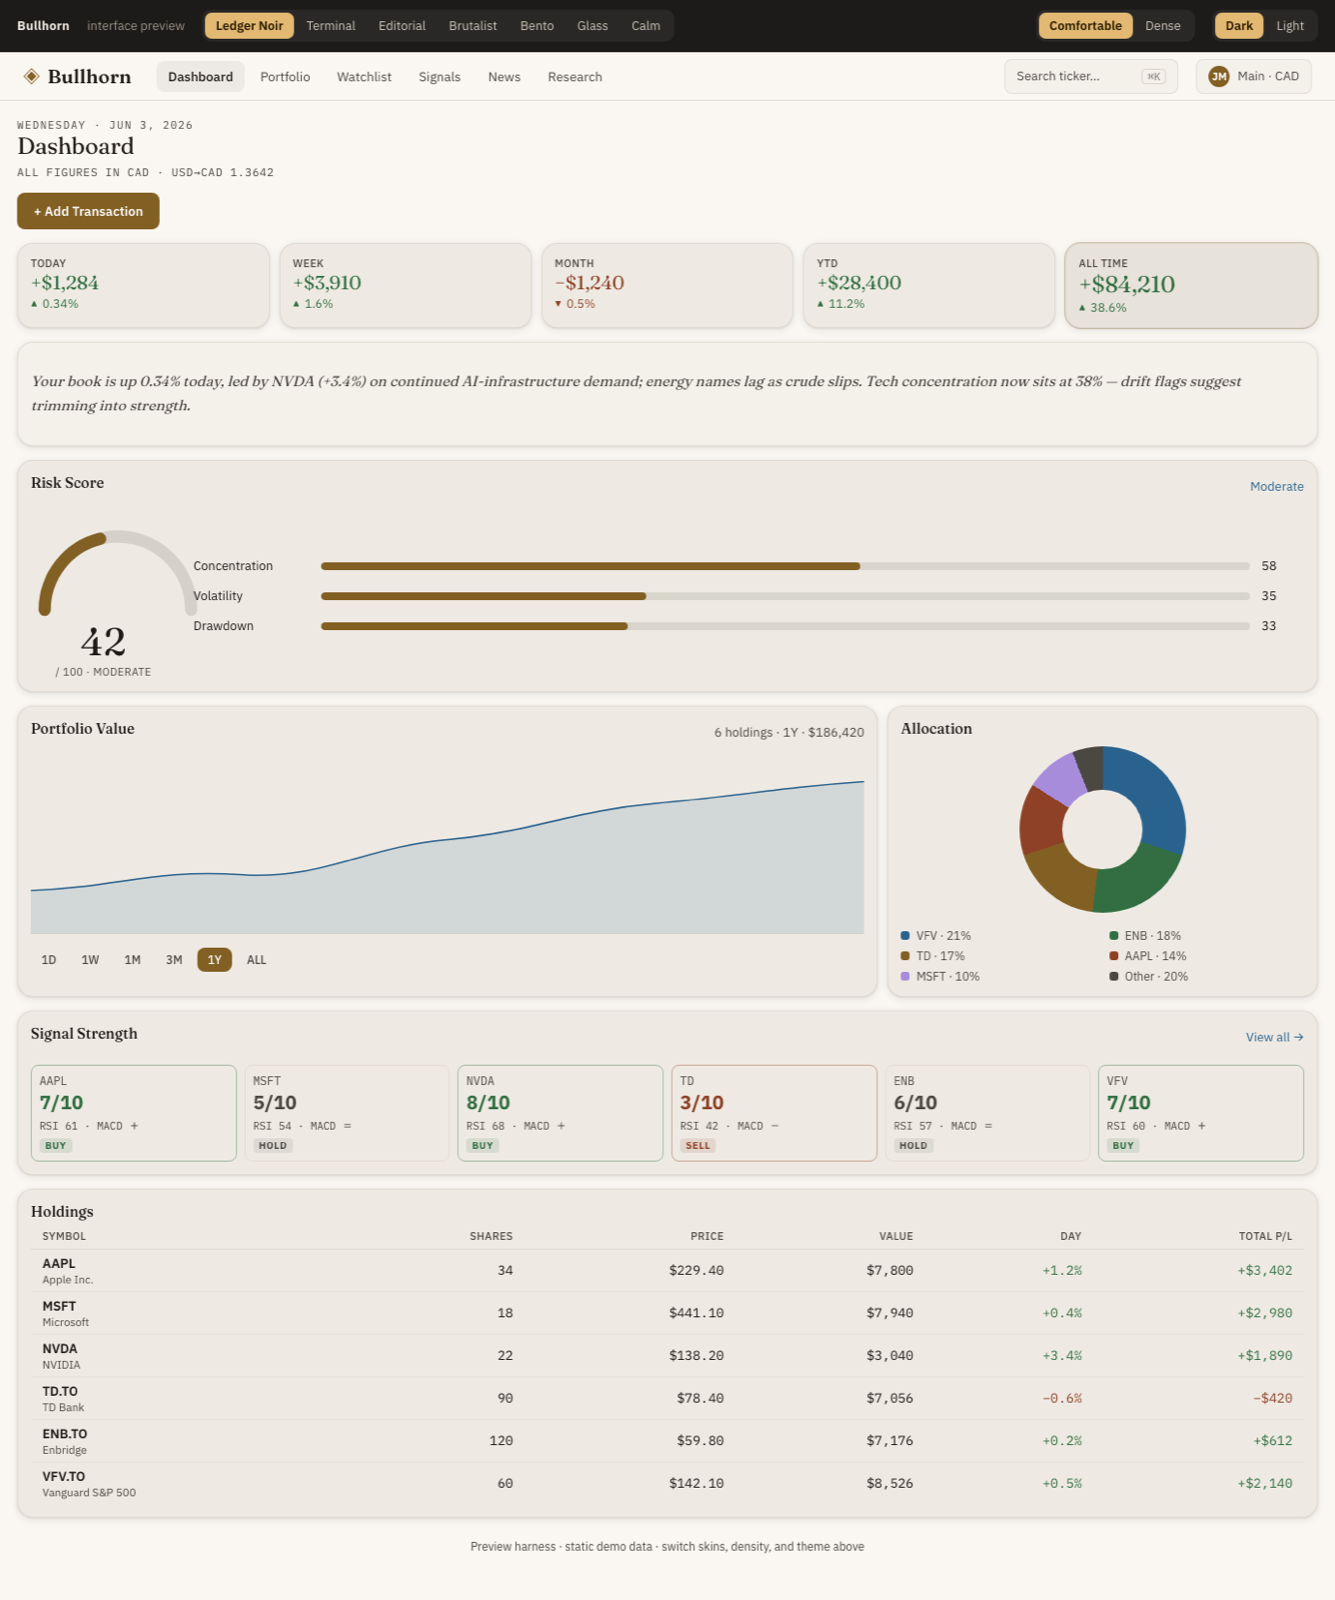
Dashboard
The whole book on one screen: net worth, a value chart, where you're allocated, what moved, and how the signals net out.

- Portfolio value chart with a selectable timeframe (week → multi-year), so you can see the trend, not just today.
- Allocation & allocation drift. Your sector weights vs. your targets — Current, Target, Drift, Delta — surfacing where you've wandered off plan.
- Top movers — the biggest gainers and losers in your book right now.
- Signal convergence & indicator strip — a snapshot of the technical picture across your holdings.
Allocation Drift is your rebalancing radar. When a sector's Drift grows, that's the cue to trim or add to get back to target weights.
Portfolio
Every position, with cost basis, live value, P&L, a trend sparkline, and a per-holding signal.
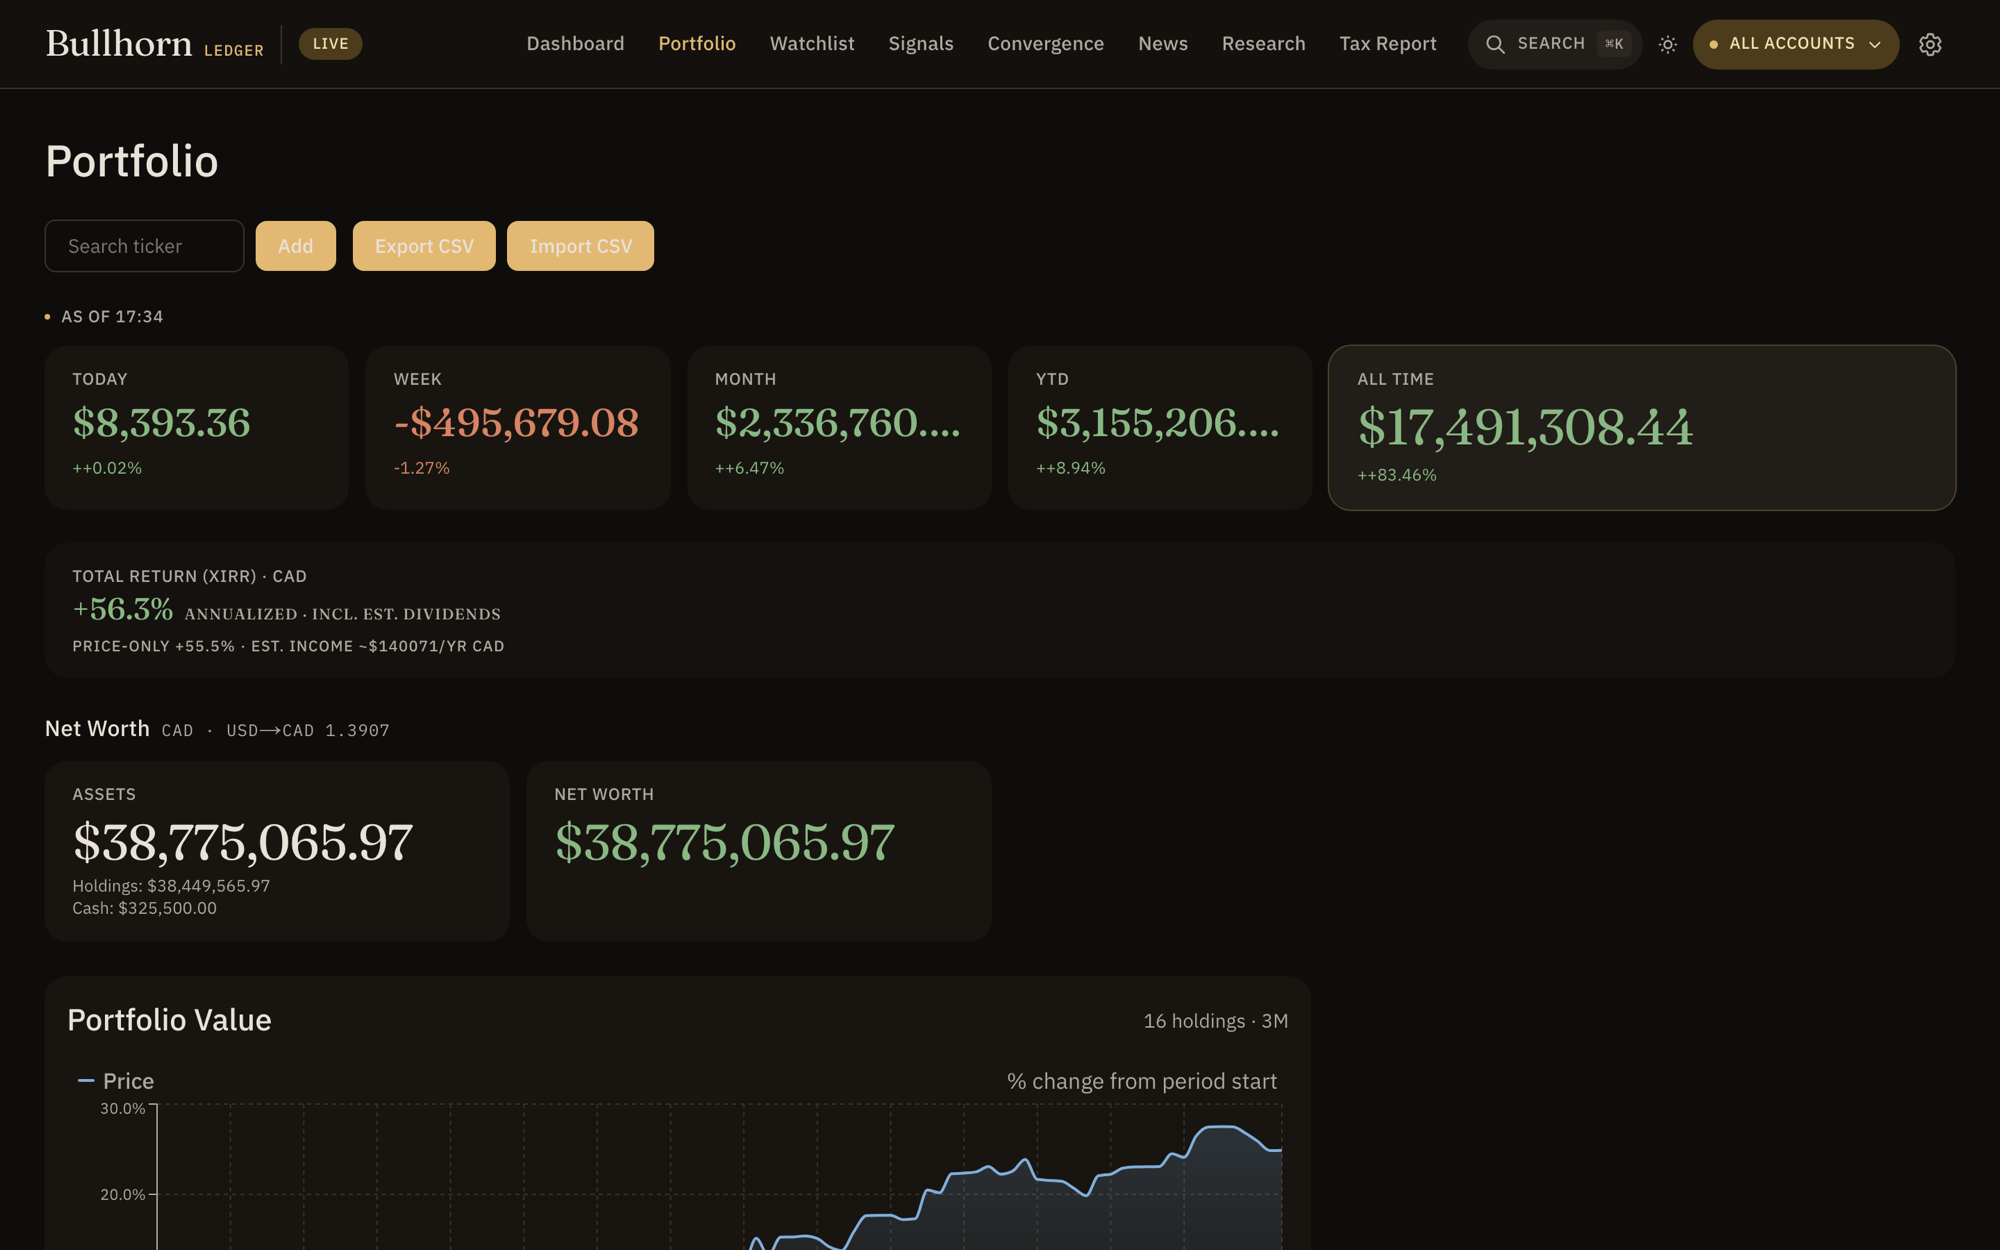
The holdings table is the heart of Bullhorn: Ticker · Avg Cost · Current · Value · Trend · Signal · Actions. Each row carries a buy / hold / sell verdict from the signal engine.
- Live cost-basis math. Avg cost vs. current price → market value and unrealized gain/loss, per position and in total.
- Per-holding trend & signal. A sparkline plus a technical badge so you can scan conviction down the column.
- Investment thesis. Record why you bought and your target — the discipline that survives a volatile week.
- Sector allocation and a portfolio value chart sit alongside the table.
- Add by search. Find any ticker and add it in seconds.
Watchlist
Track the names you don't own yet — organized, quoted live, and alert-ready.
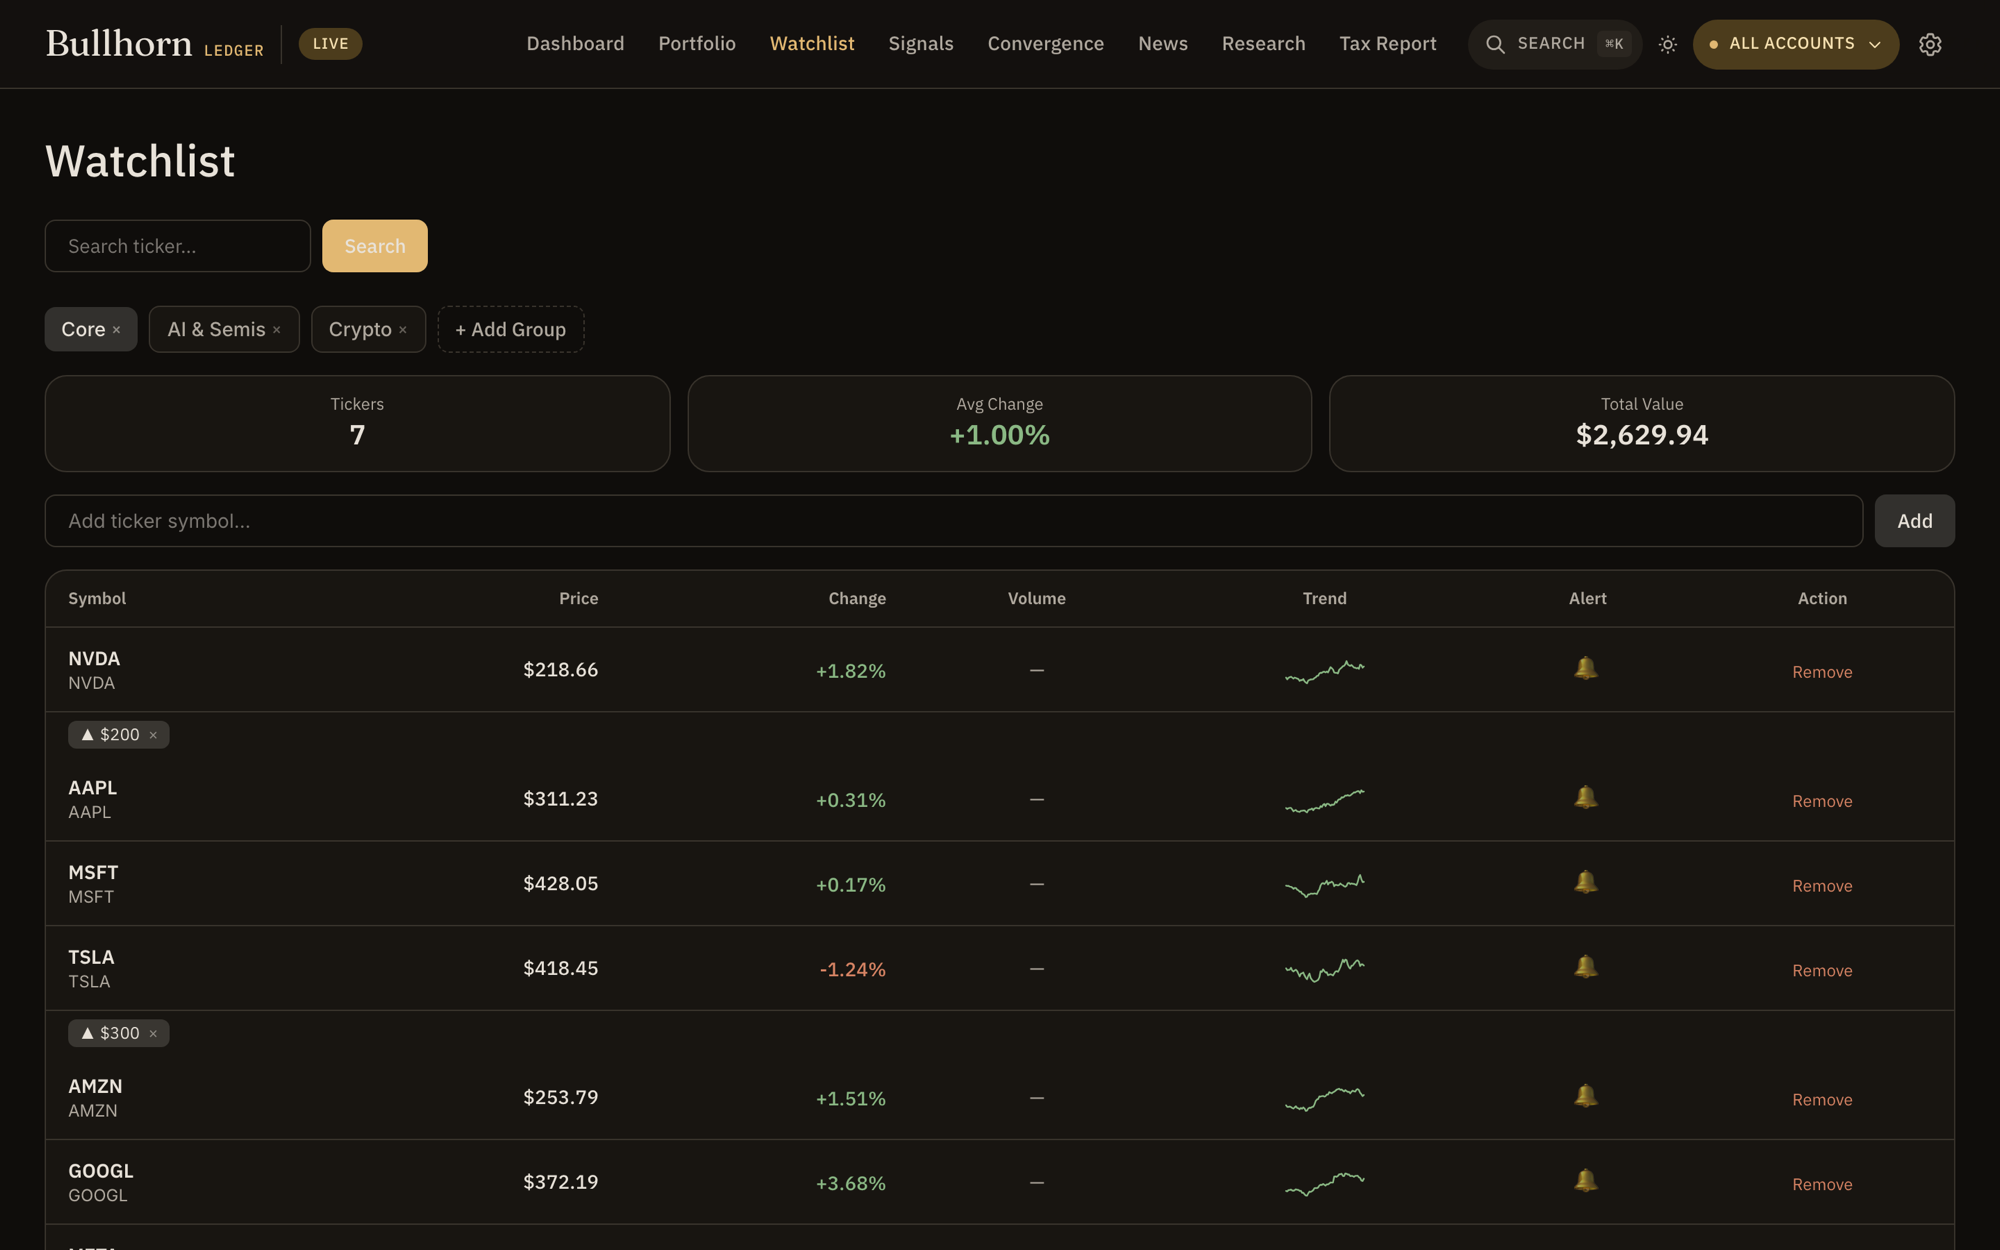
- Search & add any ticker to keep it on your radar.
- Groups. Bucket prospects into named lists — "earnings plays," "long-term," whatever fits how you think.
- Live quotes with day change so the list stays current.
- Price alerts (configured in Settings) fire when a level is crossed.
Signals
A scan across your universe — how many names are screaming buy, how many sell, and how confident the read is — plus your own custom rules.
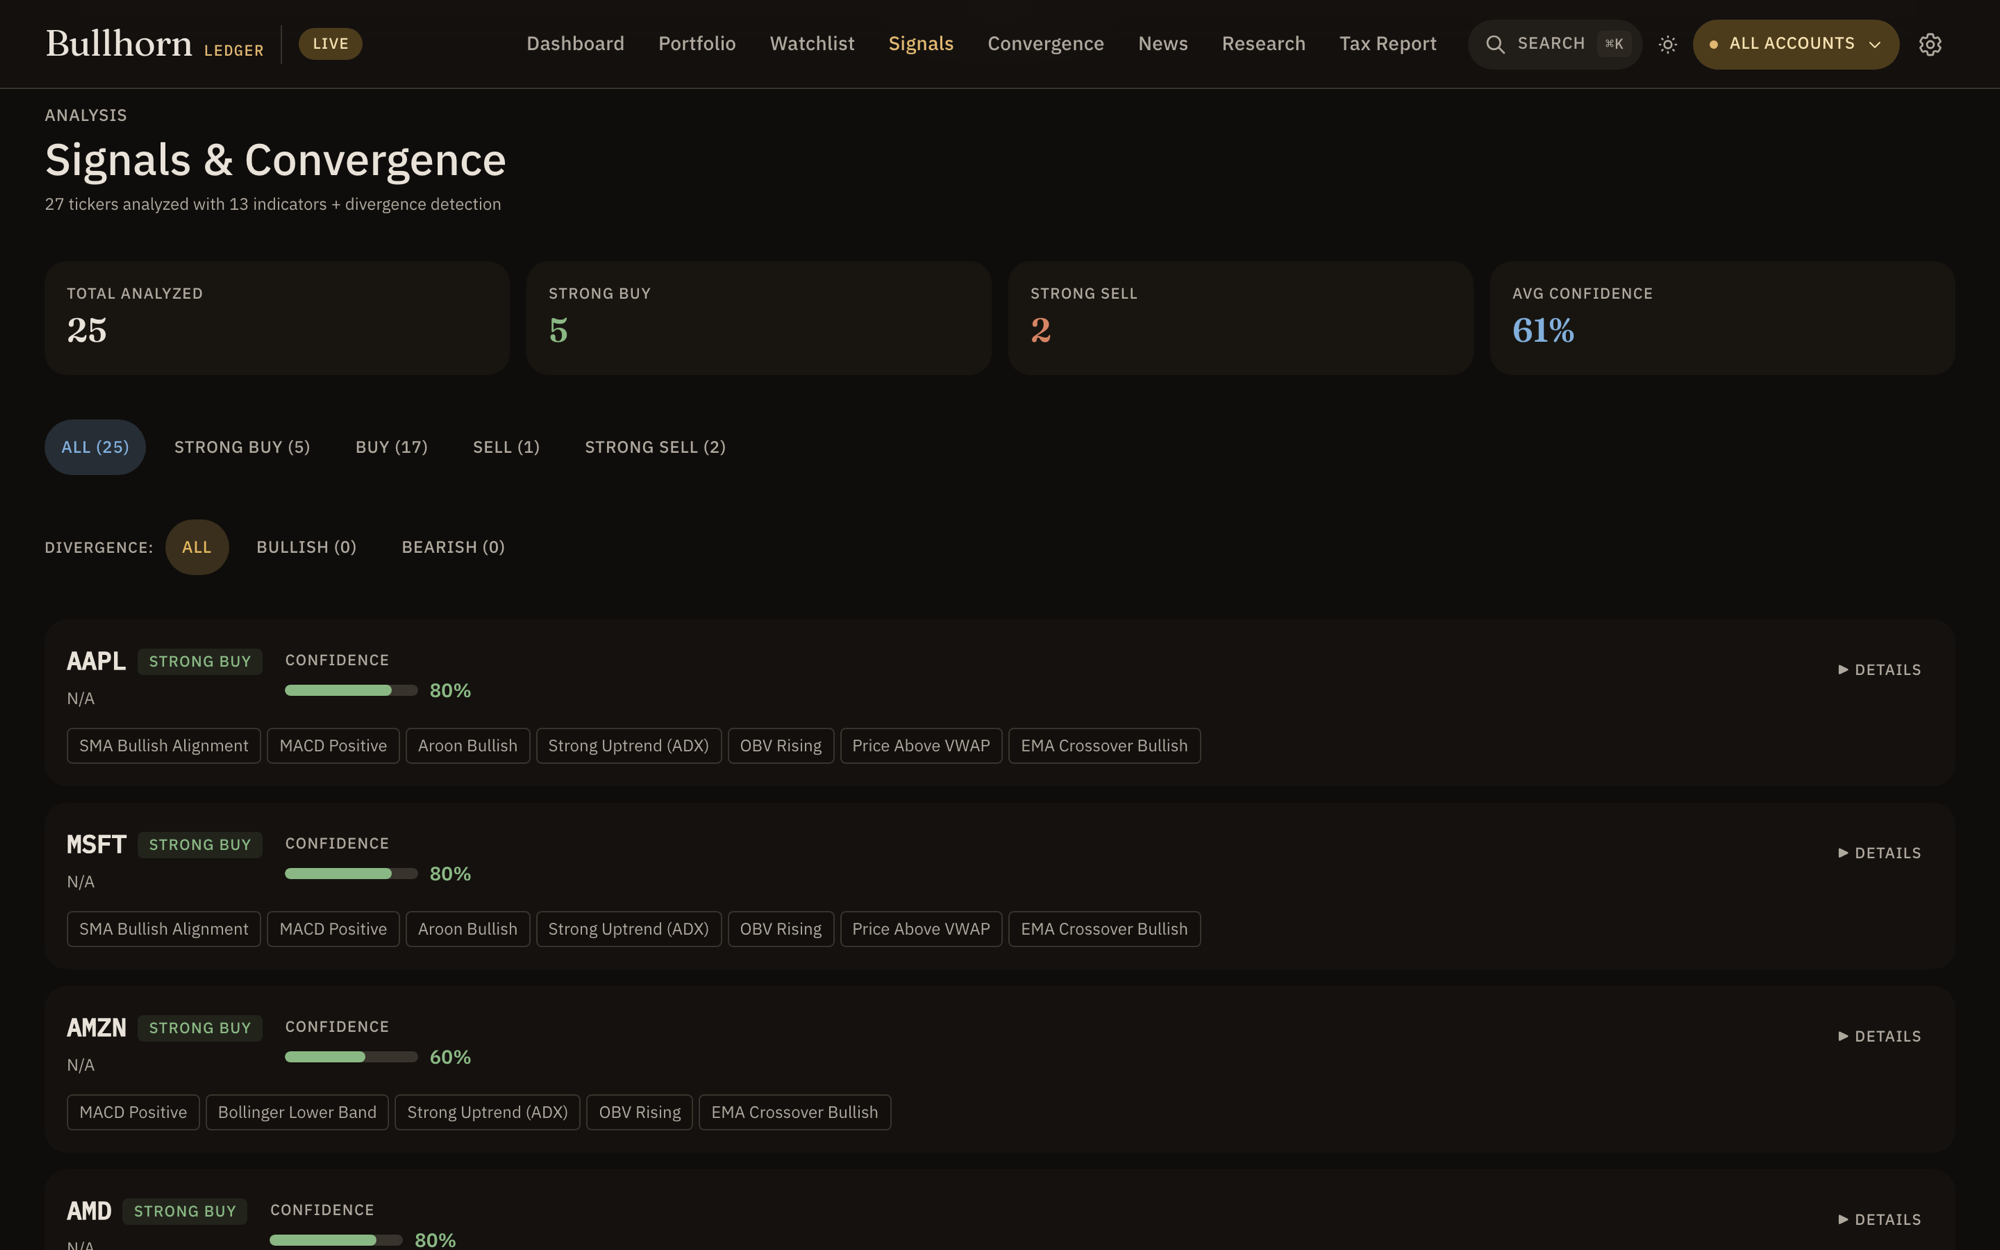
- Scan summary: Total Analyzed, Strong Buy, Strong Sell, and Avg Confidence across the set.
- Per-ticker confidence with the underlying convergence read.
- Custom rules. Define your own conditions — name a rule (e.g. "Bullish dip") and set price/score thresholds — to flag setups that match how you trade.
Convergence
The technical brain. Convergence runs a battery of indicators on each ticker and collapses them into a single, sorted verdict — strongest conviction first.
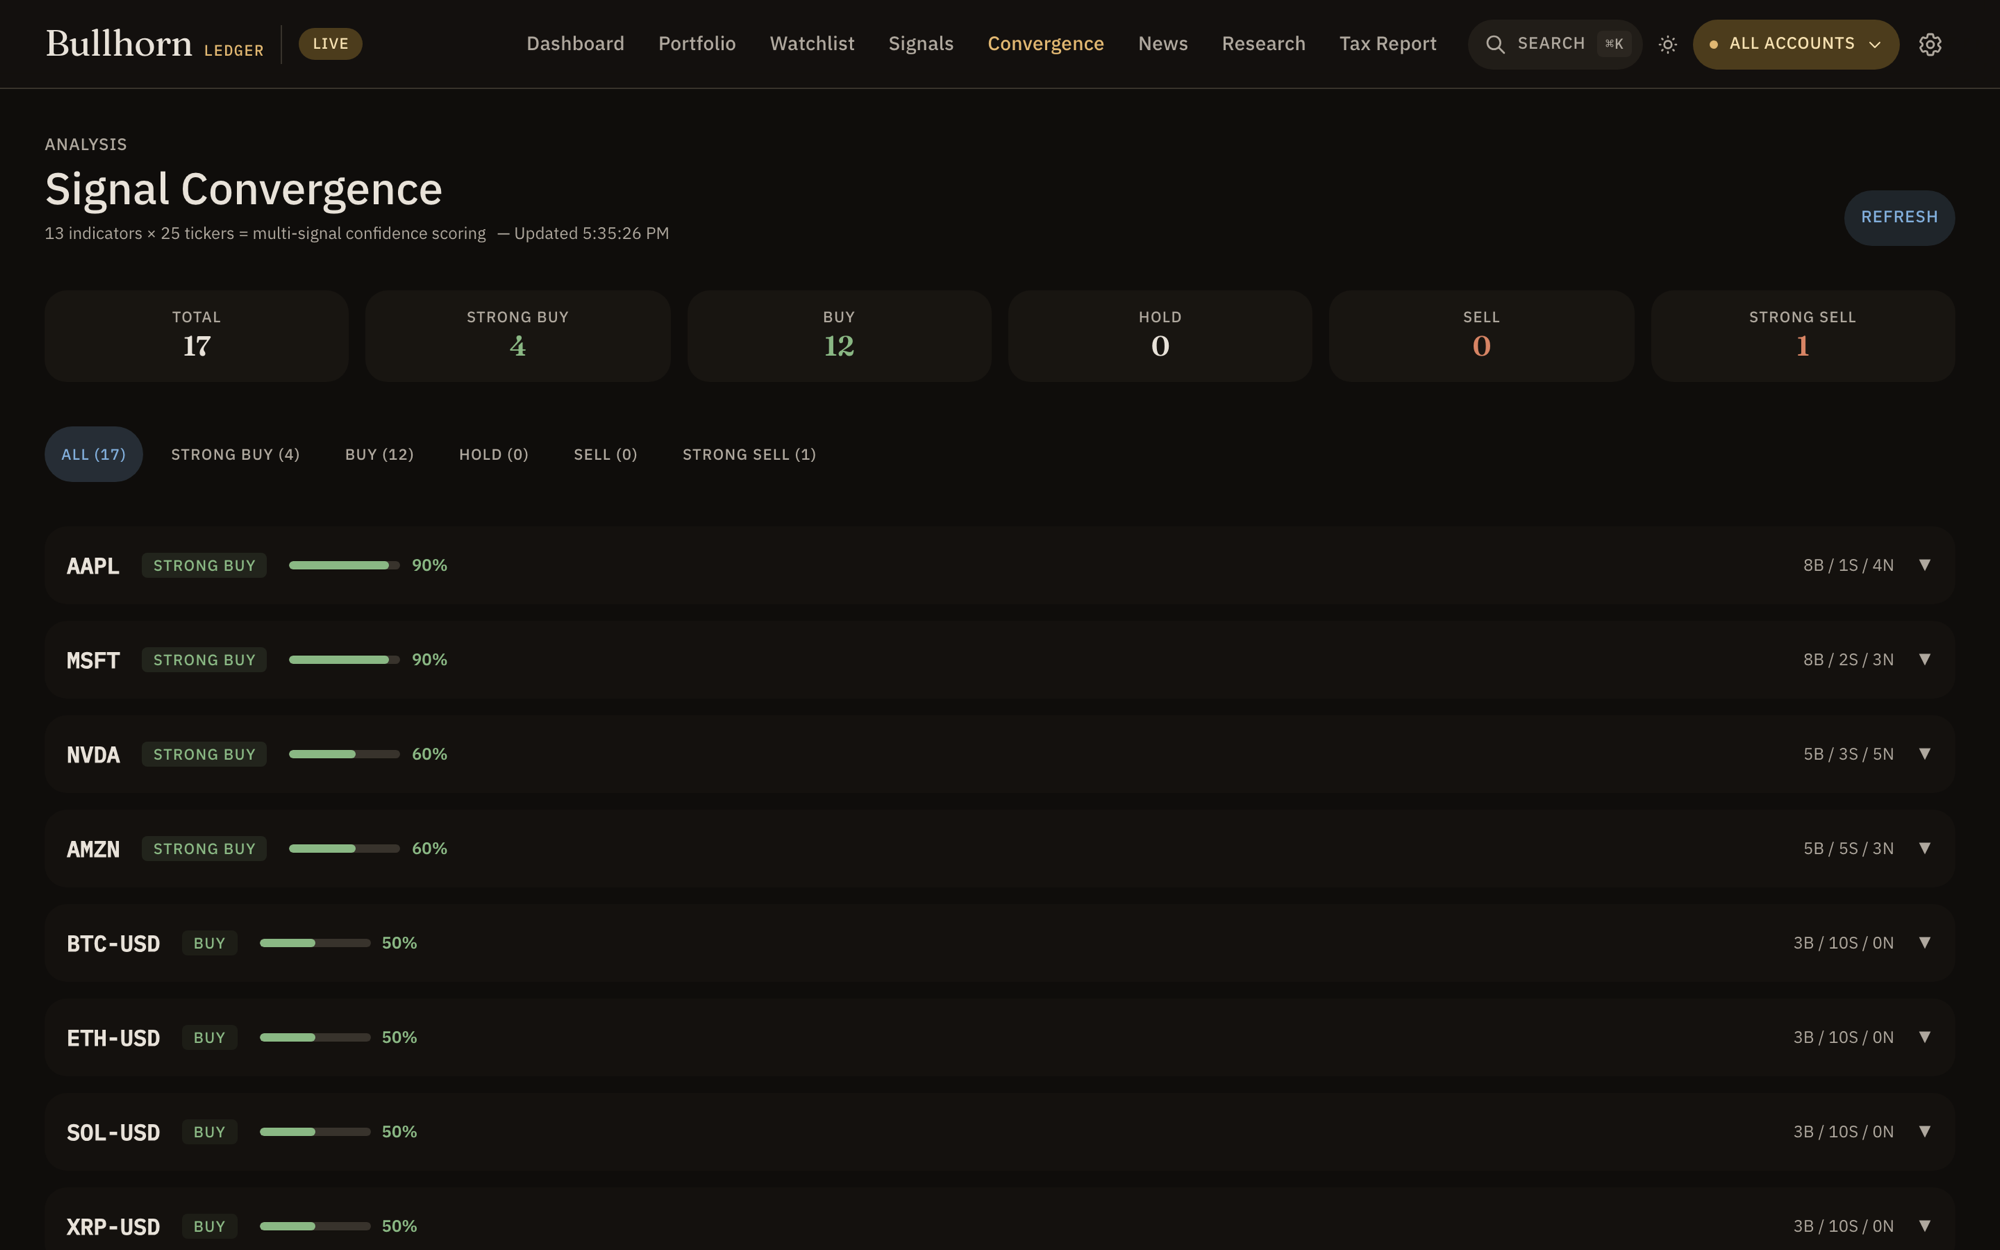
Rather than trust one indicator, Convergence asks how many agree. The more independent signals line up, the higher the conviction. Indicators include:
- One verdict per ticker: Strong Buy → Buy → Hold → Sell → Strong Sell.
- Sorted by conviction so the strongest setups float to the top.
- Polite data fetching — prices load with a concurrency cap so the app stays responsive and easy on upstream sources.
Convergence is about agreement, not magic. Treat a Strong Buy as "many indicators concur right now," and pair it with your own thesis from Portfolio.
News
A market news desk that pulls multiple feeds and tags each headline by sentiment and category — filterable down to a single ticker.
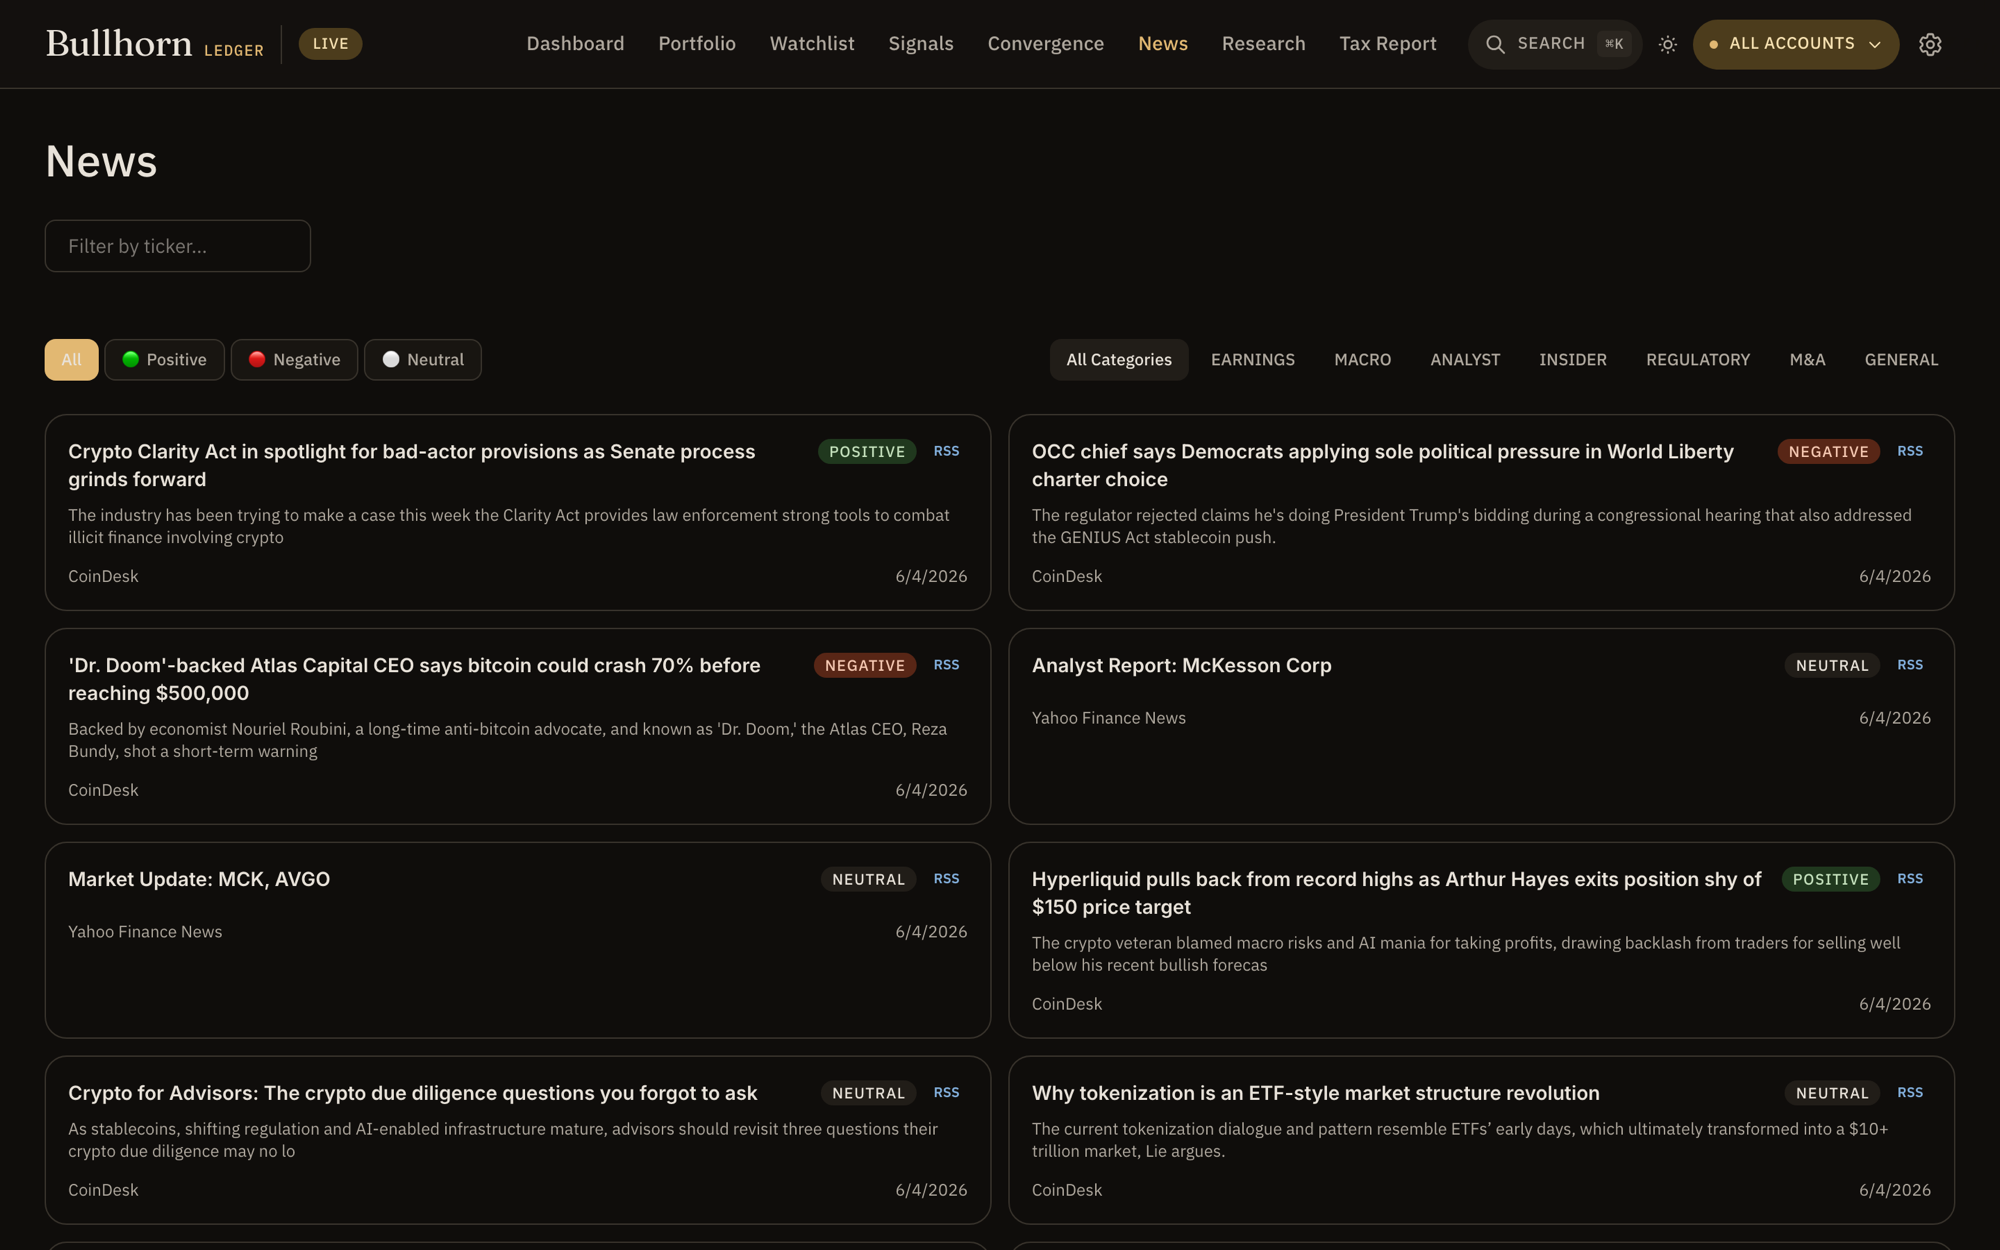
- Aggregated feeds — Yahoo Finance, MarketWatch, CoinDesk, and arXiv AI in one stream.
- Sentiment tagging — each item is scored positive / negative / neutral by a local model when available, with a keyword fallback.
- Category & ticker filters — earnings, macro, analyst, insider, regulatory, M&A, or filter to just the symbol you care about.
When a local model is running, sentiment is classified on your machine — your reading list never leaves it.
Research
Go deep on a single name. Enter a symbol and get price action, technicals, and an AI-assisted read — tuned to how you trade.
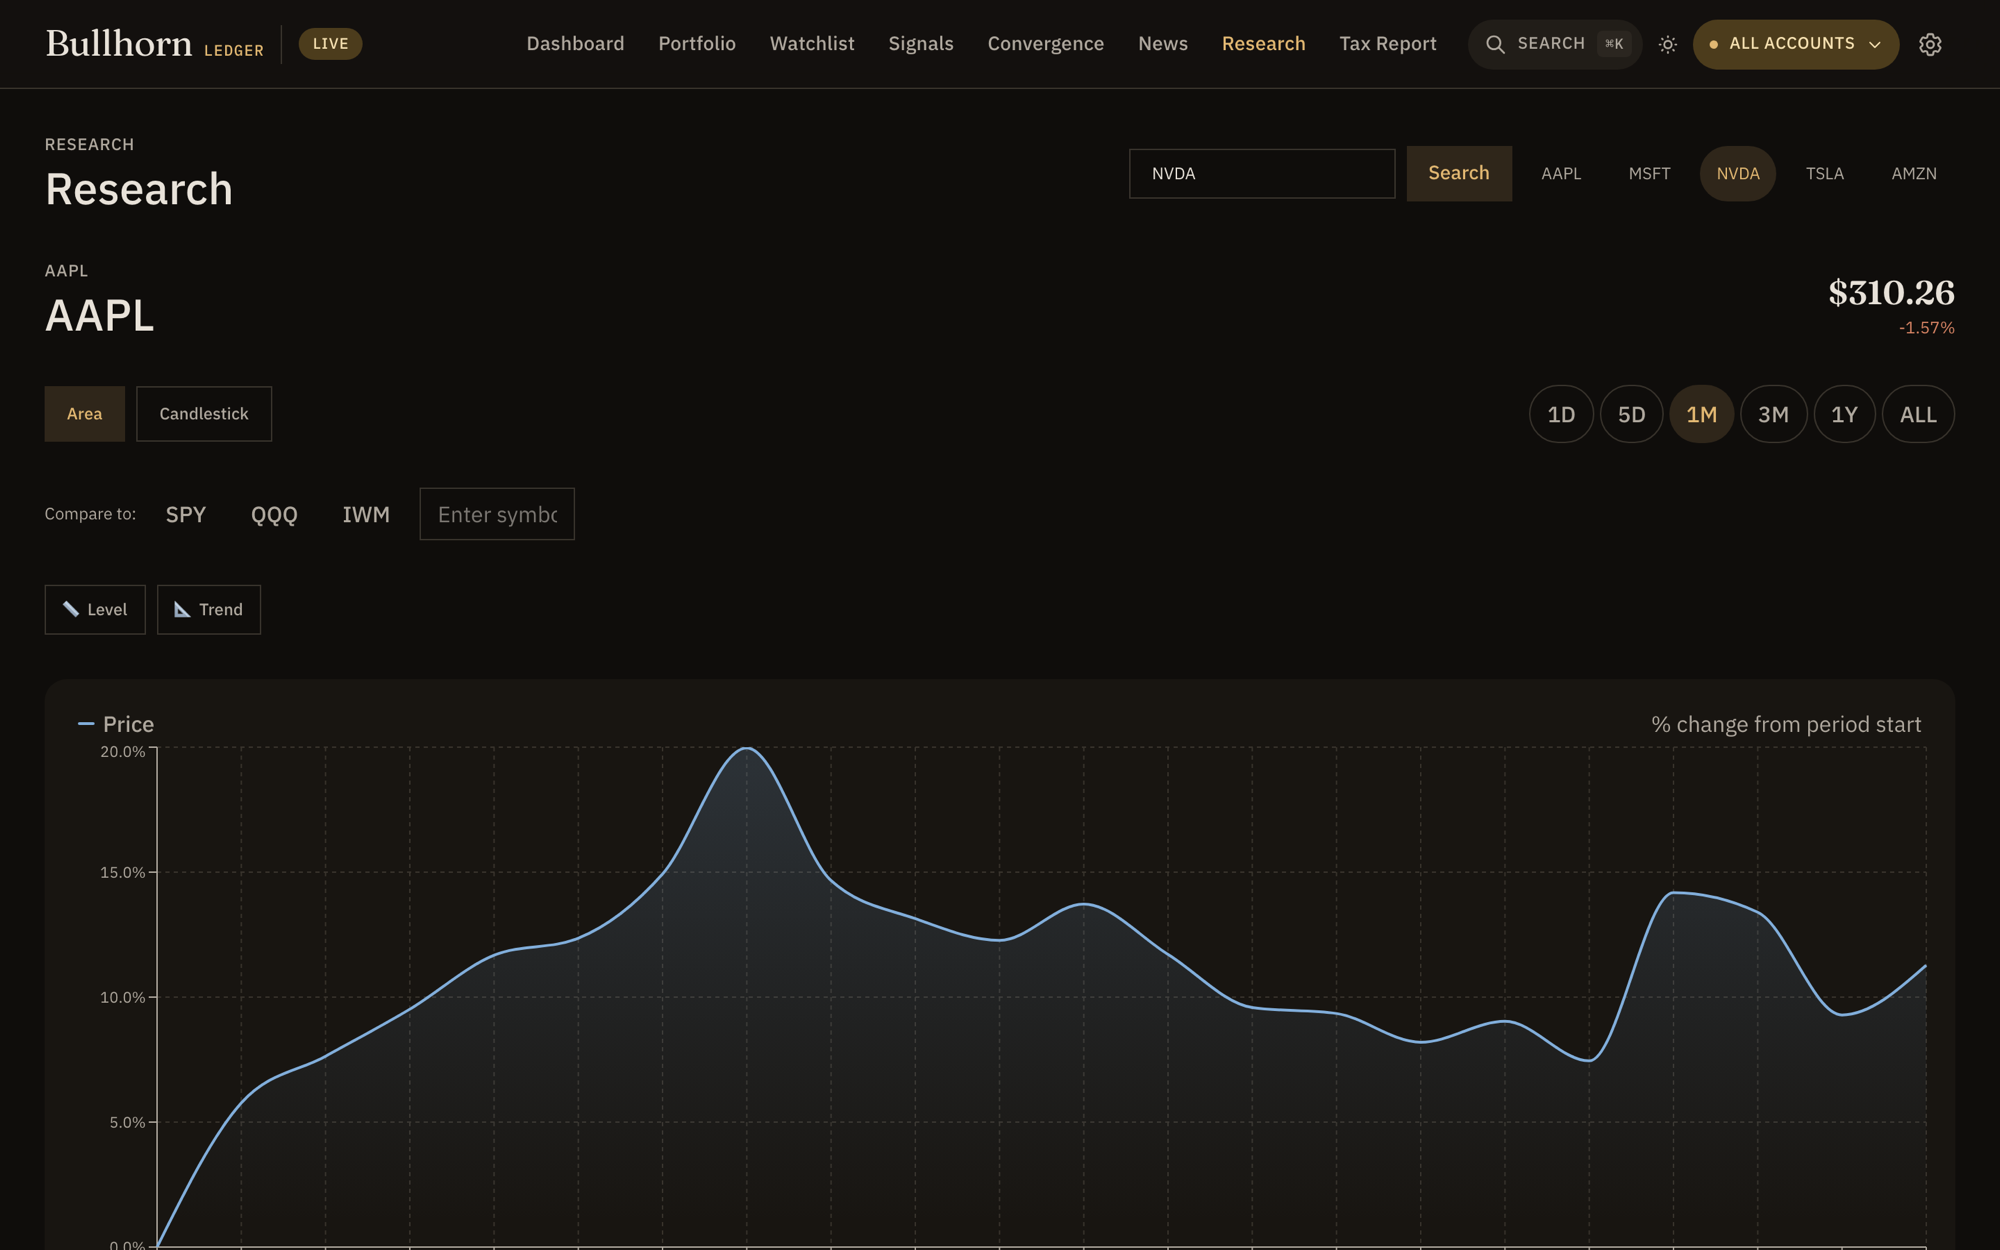
- Single-ticker deep dive — type a symbol to pull its full picture.
- AI-assisted analysis that reads the technicals and context for you.
- Tuned to your style. The trading-style profile you set in Settings shapes how the analysis is framed.
Tax Report
Realized capital gains and losses, computed from your sell transactions, in a T5008-style table.
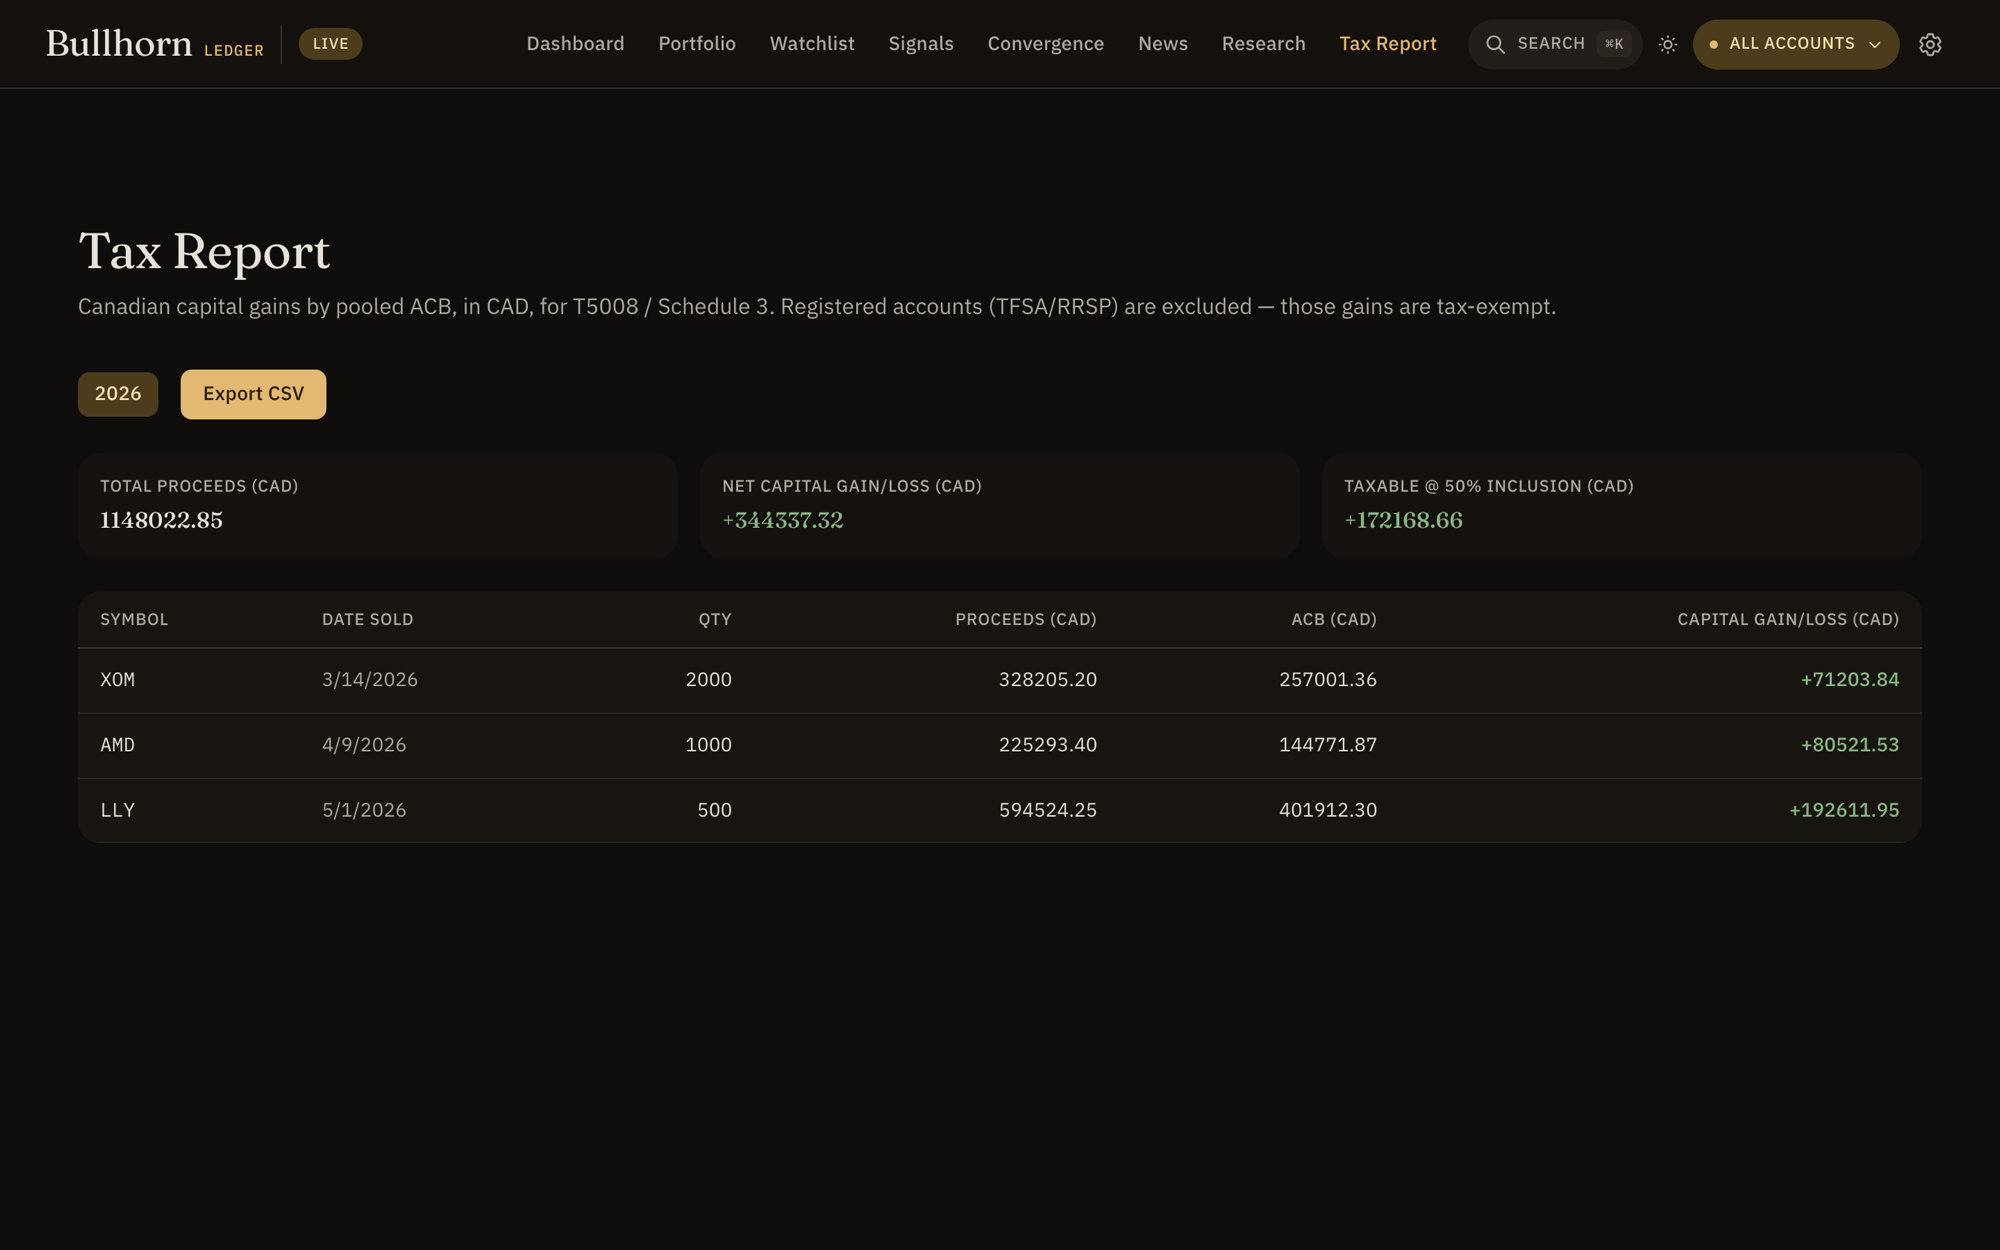
- Realized gains/losses derived from your recorded sells — proceeds vs. cost basis.
- Per-symbol, per-date breakdown: Symbol · Date Sold · Proceeds · Capital Gain/Loss (CAD).
- T5008-style view to make filing-season reconciliation less painful.
The Tax Report is informational, not tax advice. Confirm the numbers with your accountant before you file.
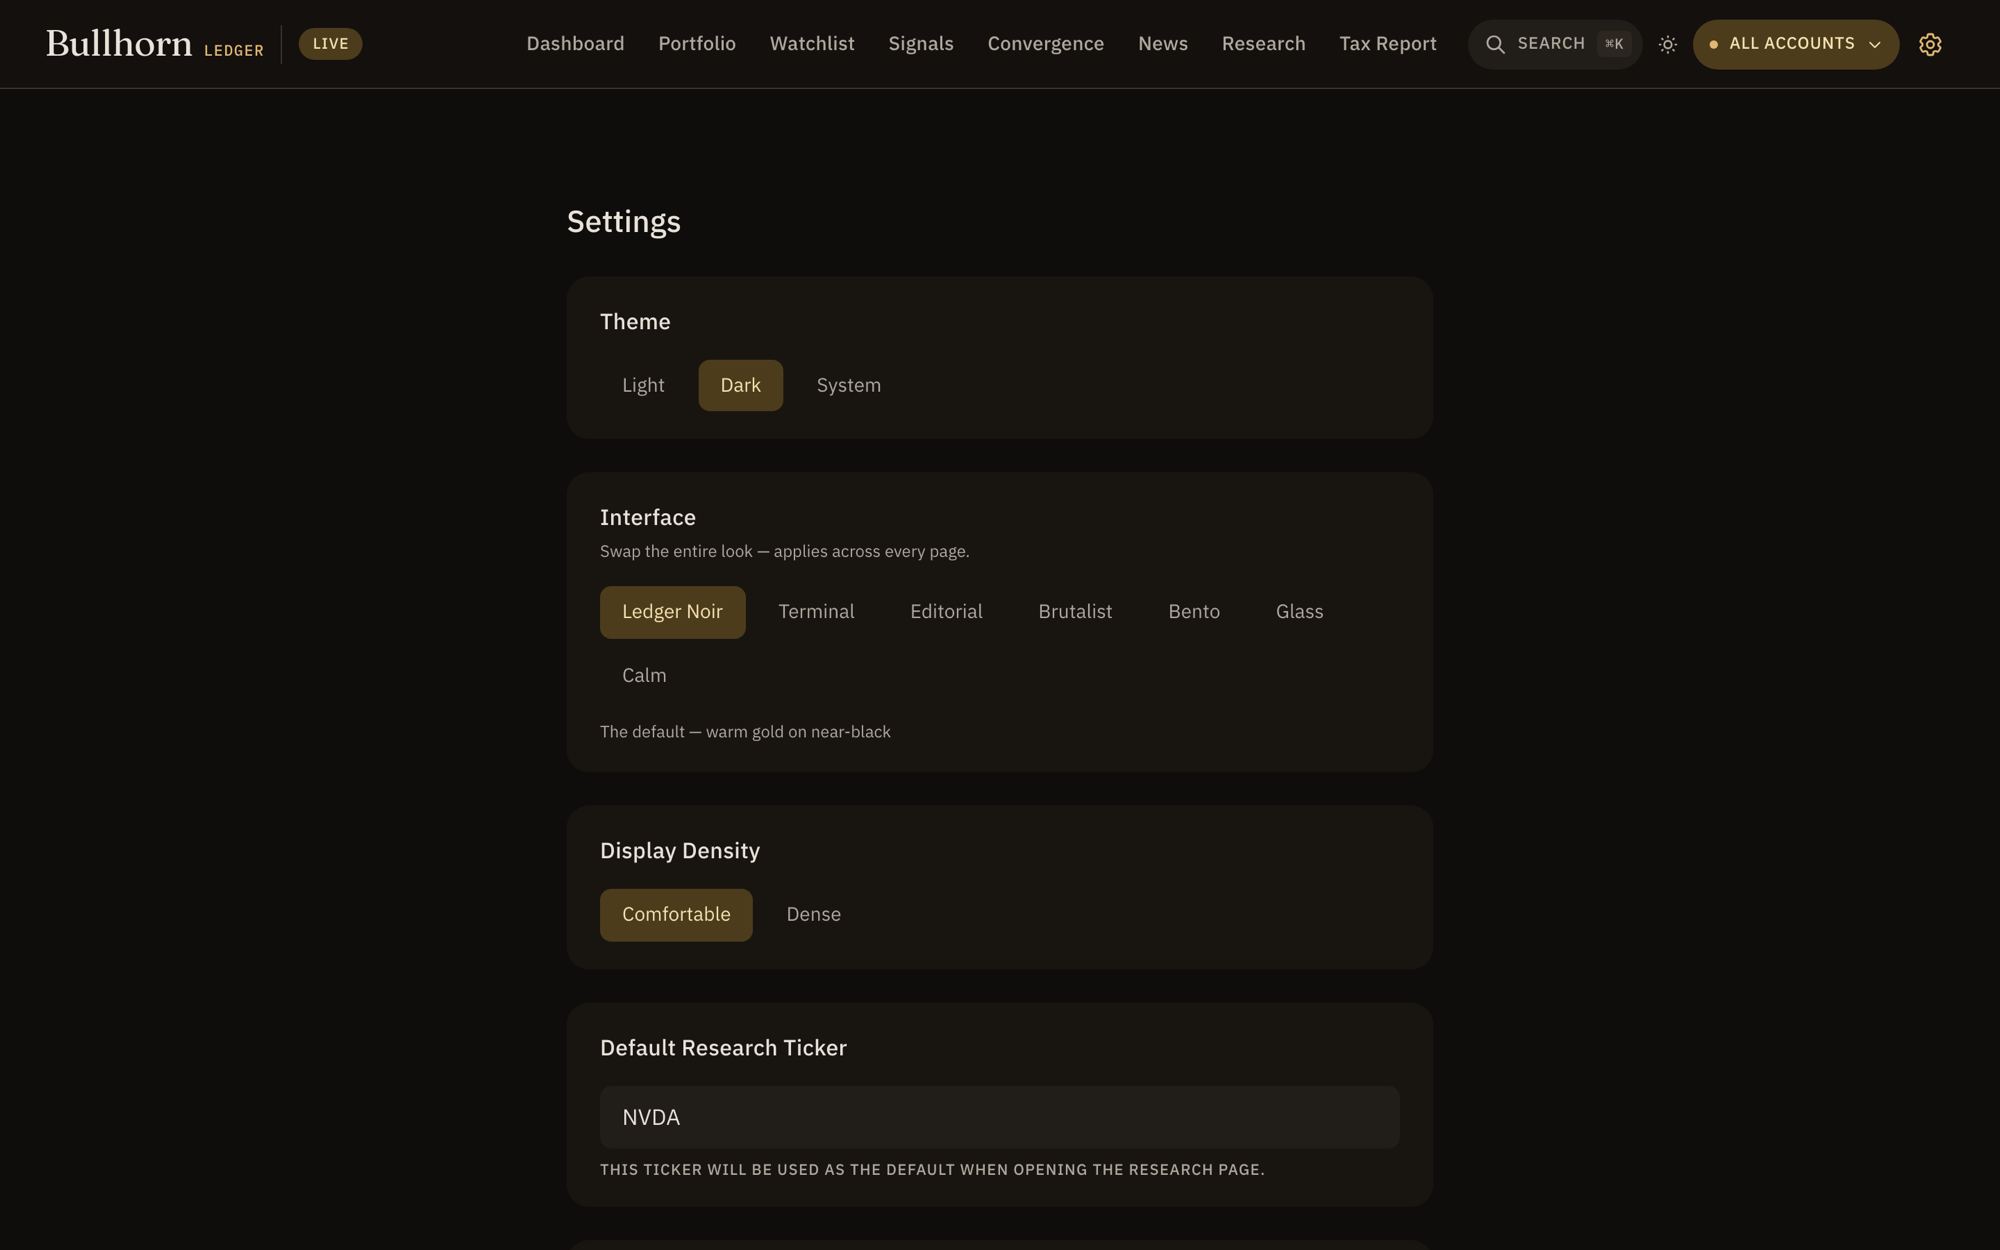
Settings
Where you manage accounts, record liabilities, tune the AI, set alerts, and choose how the app looks.
- Accounts — create, rename, and select; toggle the all-accounts aggregate.
- Appearance — pick one of seven skins and a comfortable or dense layout (see below).
- Liabilities — mortgage, credit card, or other balances, folded into net worth.
- Trading-style profile — describe how you trade so AI analysis speaks your language.
- Price alerts — set the levels that should get your attention.
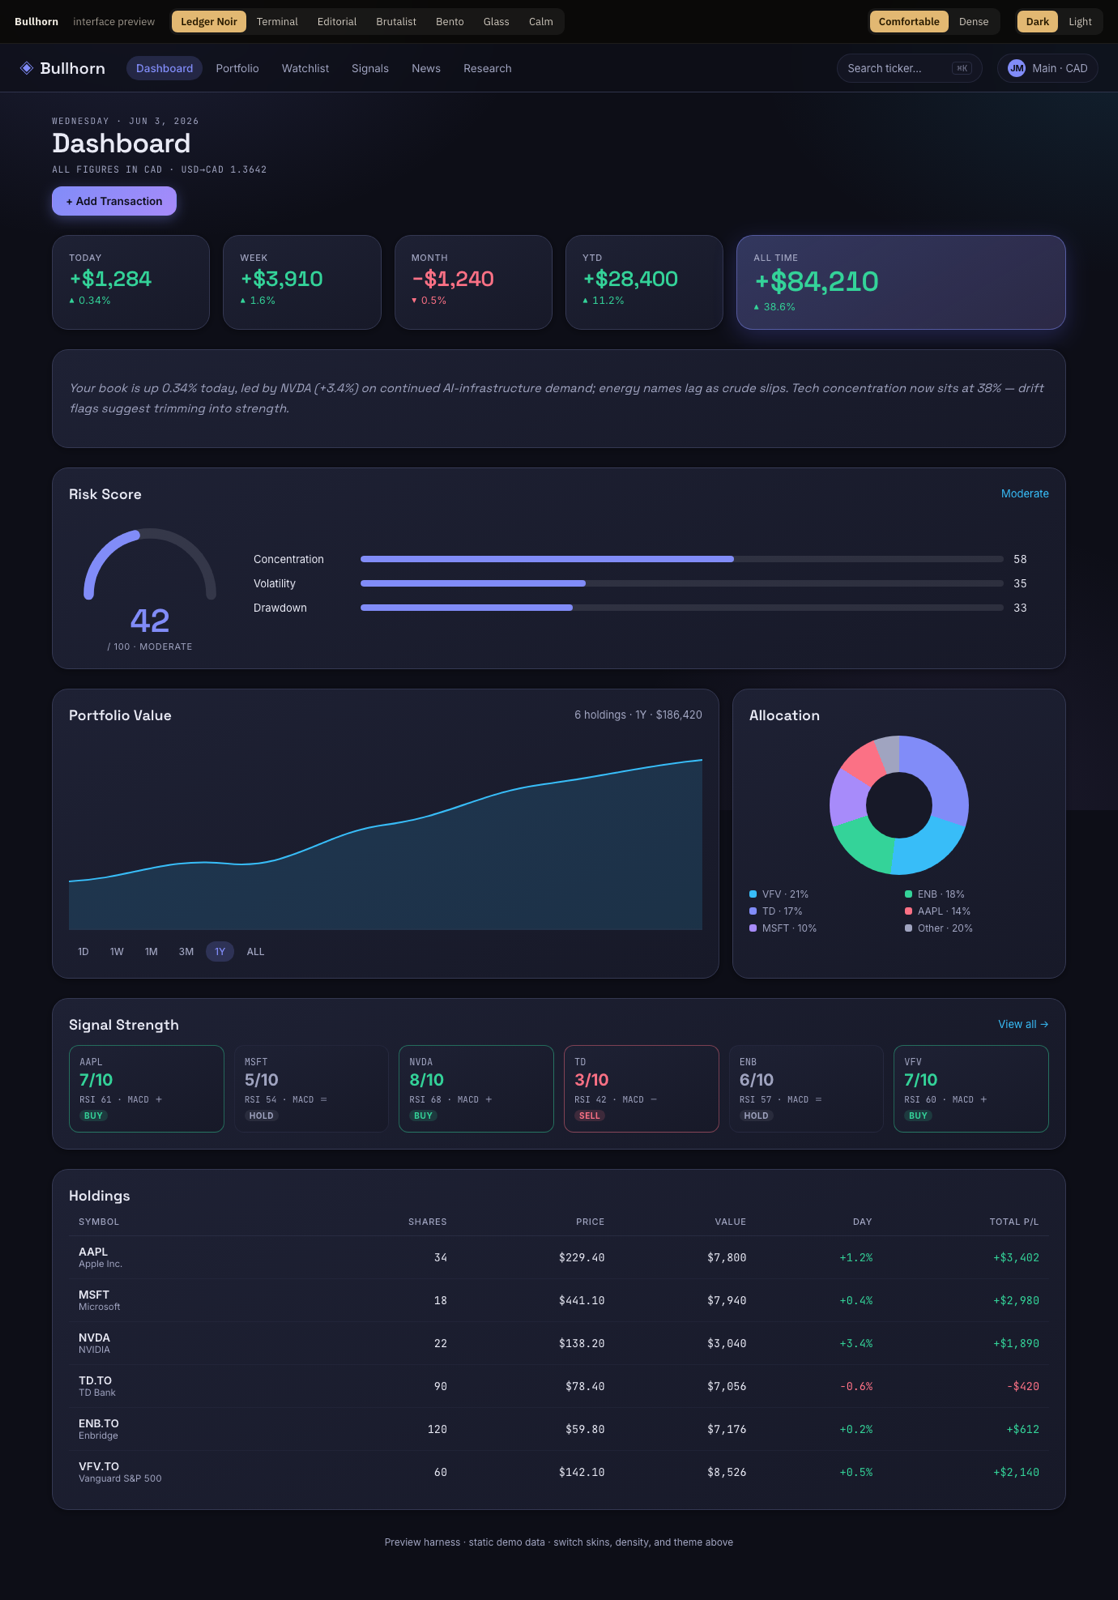
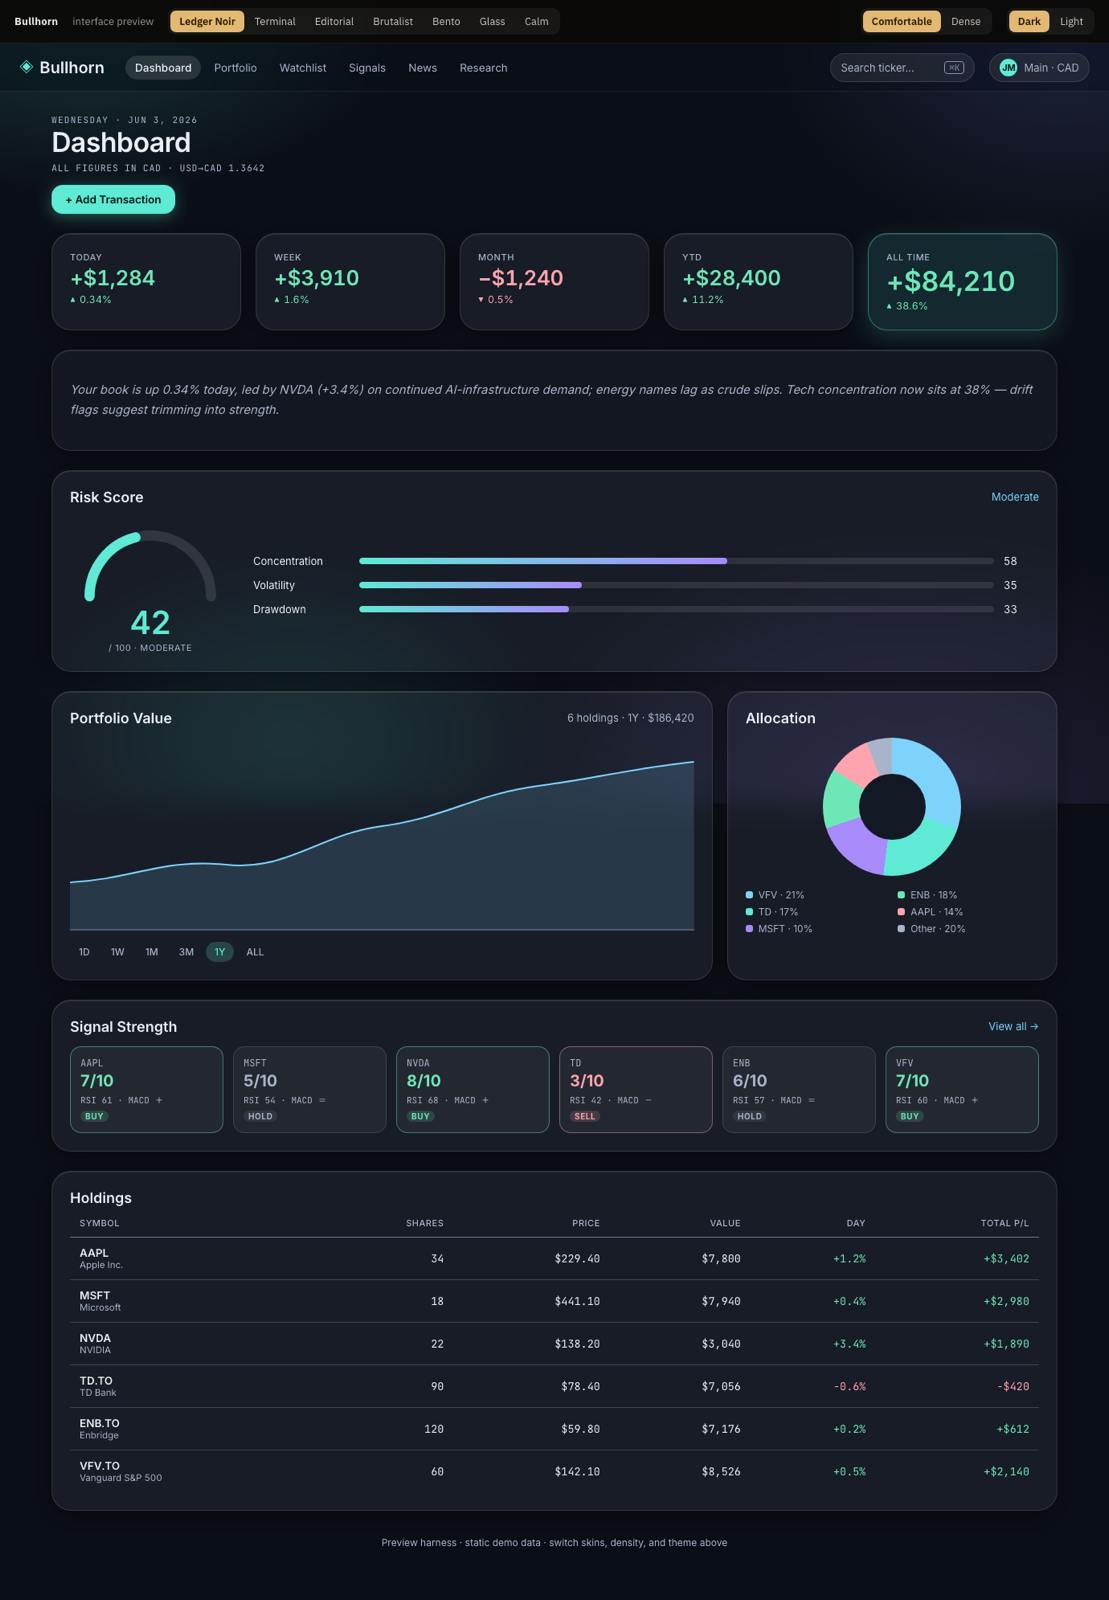
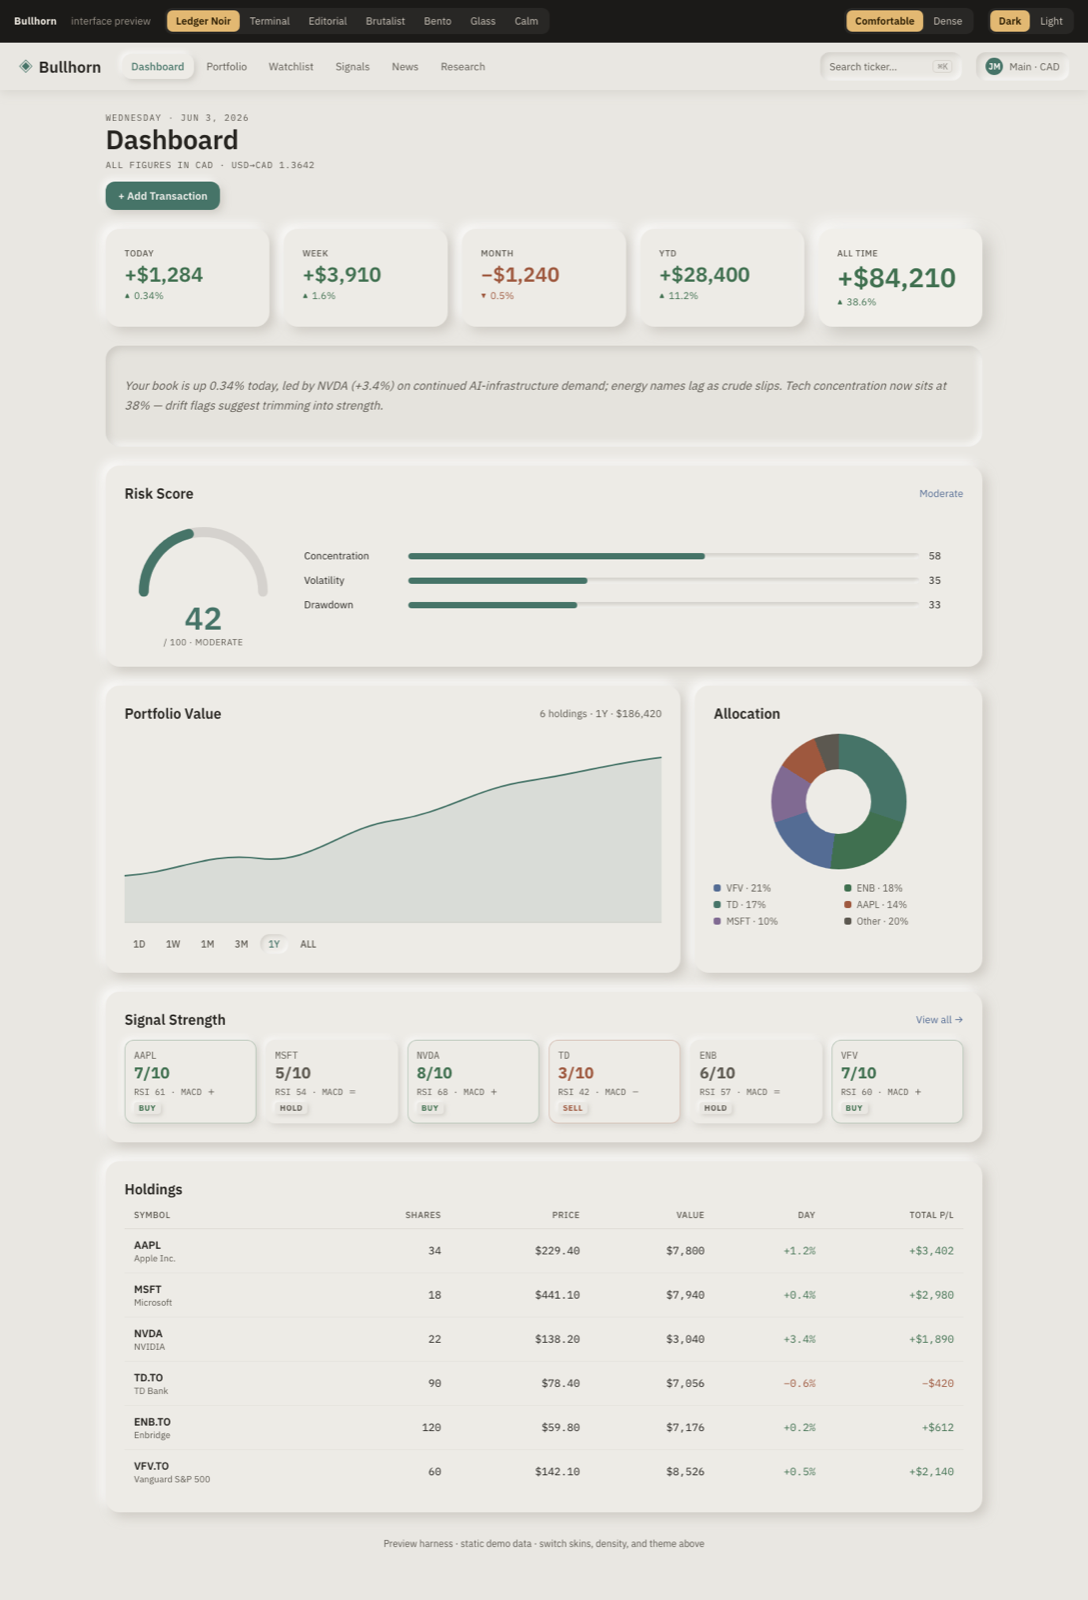
Skins & appearance
Same data, seven personalities. Switch the entire interface from Settings → Appearance. Density (comfortable / dense) is an independent toggle on top.
Privacy & your data
Bullhorn is local-first. That's not a marketing line — it's where your data physically is.
- No account, no upload. Your holdings, accounts, cash, and notes live in your browser's local storage on your device.
- Prices & news are fetched on demand from public market endpoints — Bullhorn asks for a quote, it doesn't ship your book anywhere to get one.
- Paper mode is namespaced separately, so experiments never bleed into your real data.
- You hold the off switch. Clearing your browser's site data for Bullhorn clears Bullhorn — there's no server-side copy to chase down.
Because data lives in this browser, it doesn't automatically follow you to another device or browser. Treat it like a local app: back up anything you'd hate to re-enter.
FAQ
Is my financial data sent to a server?
No. Your holdings, accounts, cash, liabilities, and notes are stored locally in your browser. Bullhorn only reaches out to fetch public market prices and news on demand.
Where do the prices come from?
Live quotes and historical charts are pulled from public market data endpoints when you open a screen. Nothing about your positions is sent along with those requests.
What's the difference between Live and Paper?
Live is your real book. Paper is a separate sandbox stored under its own namespace — perfect for test trades and what-ifs. Switching between them swaps the whole dataset; your live data is untouched.
Can I track more than one account?
Yes. Create as many accounts as you need and switch between them, or use the "All accounts" aggregate to see everything as one combined book.
Is the Tax Report official?
It's a convenience view of your realized gains and losses in a T5008-style layout. It is informational only — verify with your accountant before filing.
How do I change how Bullhorn looks?
Settings → Appearance. Choose one of seven skins and a comfortable or dense layout. The change applies instantly across every screen.
Will my data move to another device?
Not automatically — it lives in this browser. If you switch devices or clear site data, you'll start fresh, so keep your own record of anything important.